Monday, September 24, 2018

Why State-Level Presidential Job Approval Matters In Midterm Elections

History has shown midterm results can be unkind to the president's party when the president's job approval rating is under 45%.

Given that midterm elections have long been thought of as referendums on the president’s party, it seems like a worthwhile venture to take a look at Donald Trump’s job approval rating in the states holding senate and gubernatorial contests this November. By examining the results of past contests, and comparing them to state-level presidential job approval, patterns emerge that offer insight into what to expect after the dust settles on November 6.

For the purposes of this article, exit polling from the last four midterm elections was used to determine the president’s job approval rating in any given state (2014, 2010, 2006, 1998). Because of issues with the data at the time it was taken, exit polling from the 2002 midterm election is excluded.

To begin, three important rules emerge from looking at presidential job approval ratings as compared to midterm senate and gubernatorial results:
  1. When the president’s job approval rating is under 45% in a particular state, there’s a strong chance (85%) that the non-presidential party will either flip that seat to their side, or at least hold the seat for their party.
  2. When the president’s job approval rating is between 45-49% in a particular state, the odds of the non-presidential party flipping or holding the seat are about even (56% of the time). 
  3. When the president’s job approval rating is at 50% or greater, the odds of the non-presidential party flipping or holding the seat are only a little better than one in three (38% of the time)
To see how I arrived at these conclusions, consider the tables below, which document the number of senate and gubernatorial contests that fell into one of these three ranges of presidential job approval in the last four midterm elections. 


The fifth table combines the data from the previous four midterm cycles into one, making for larger sample sizes. The overall trend holds across a total of 210 exit-polled senate and gubernatorial contests.


As you can see, over the last four midterm cycles, there were 89 exit-polled senate and gubernatorial contests in which the president's approval rating was under 45%, and the party out of presidential power won 76 of them. There were 43 exit-polled contests in which the president's approval rating fell between 45-49%, and the party out of presidential power won 24 of them. There were 78 exit-polled contests in which the president's approval rating was at 50% or higher, and the opposing party only won 30 of them.

What are the implications for Republican prospects in senate and gubernatorial contests this November,  given the opposing party's performance within a range of presidential job approval over the past four midterm cycles? That depends on Donald Trump’s state level job approval rating.

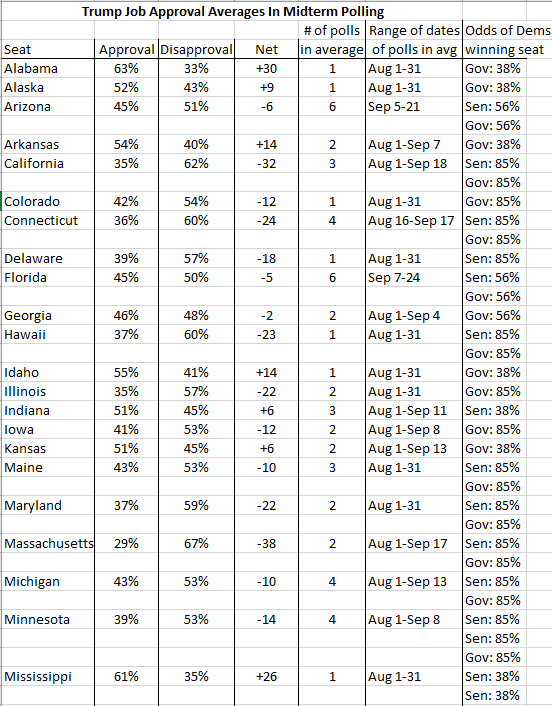
The table below documents just that - the president's average approval rating in every state holding a senate or gubernatorial contest this November.

Please ask if you would like access to the data used in compiling Donald Trump's state-level job approval ratings.

There's some obvious bad news here for President Trump. His approval rating is currently under 45% in more than half (56%) of the senate and gubernatorial contests to be held in November. Why is that bad for the president? Because the party out of presidential power wins senate and/or gubernatorial midterm contests 85% of the time when the president’s approval rating is under 45%.

The good news for President Trump? It could be worse. Take the 2014 midterm election, for example. Barack Obama's job approval rating was under 45% in 70% of the exit-polled senate and gubernatorial contests. Republicans ended up gaining 9 senate seats and 2 governor's mansions. Likewise, George W. Bush saw his approval rating under 45% in 65% of exit-polled senate and gubernatorial contests in 2006, earning Democrats 6 senate seats and 6 governorships.

The table below illustrates presidential job approval in exit-polled senate and gubernatorial contests from the 2014, 2010, 2006, and 1998 midterms, and compares that to President Trump's job approval rating in states holding contests this November. As you can see, Barack Obama in 2014 and George W. Bush in 2006 were very unpopular in the majority of exit-polled contests. Bill Clinton in 1998 was quite the opposite. President Trump's job approval rating, as of today, falls in between them.


Based on what we know from past midterm exit polling, what does Trump’s state-level job approval ratings tell us about what to expect on election night? In a nutshell, it confirms what we already knew. If presidential approval polling was our only metric to go by in predicting the results of upcoming senate and gubernatorial contests, it suggests that Democrats will pick-up a whole bunch of governorships, and will lose three senate seats (making the composition of the Senate 54 Republicans, 46 Democrats/Independents). This is roughly in line with most forecasts, as well as current state polling averages of senate and gubernatorial contests.

Ask if you would like access to the data used to compile state averages. Data mostly comes from public sites such as Real Clear Politics, Wikipedia, and Dave Leip's US Election Atlas.  

As you can see from the table above, current senate polling averages suggest that if the election were held today, Republicans would end up with 49 senate seats, Democrats would end up with 50 seats, and 1 seat would be a toss-up. The polling suggests that Democrats would flip Arizona, Nevada, and Tennessee. Republicans would flip North Dakota. Missouri would flip from blue to toss-up.

Regarding gubernatorial contests, the table above suggests that the Republican's 33 seat majority would drop to just 24 governorships if the election were held today. The number of Democrats in governor's mansions would increase from 16 to 25. There would be one toss-up. Current polling suggests Democrats would flip 9 state governorships - Nevada, New Mexico, Kansas, Iowa, Wisconsin, Illinois, Michigan, Georgia, and Florida. The Republicans would pick-up one seat in Alaska. Maine is presently a toss-up given the only poll we've had of the race.

The bottom line is that with President Trump currently under the critical 45% approval mark in over half of the contests taking place this November, Republicans have a lot of exposure. While the current composition of the Senate doesn't look as though it will change all that much, even a minor shift could give Democrats control of the chamber. And the partisan composition of state governor's mansions is likely to look very different on Wednesday, November 7. The Trump Admin has two things on their side - time, and the fact that they are not currently in as bad of shape, from a job approval perspective, as Barack Obama and George W. Bush were at this point in 2014 and 2006, respectively. But time can be a double-edged sword. Things could get better for Republicans, or worse.

Friday, March 18, 2016

Hillary Clinton, Donald Trump, and the Impending Gender-Gap Explosion


In every presidential election since exit polling began over forty years ago, Democrats have performed stronger among women than men, while Republicans performed stronger among men than women. Of the eleven elections since 1972, Democrats have lost the female vote in four (1972, 1980, 1984, & 1988), all of which resulted in electoral landslide defeats for their party. The same is true for the three of eleven elections (1976, 1992, and 2008) where Republicans lost the male vote.

While the difference in voting patterns between the sexes is clear, the extent of that difference has varied widely throughout the years. In the most recent presidential election, the Democratic incumbent carried women by eleven points, while the Republican challenger carried men by seven, creating a gender-gap of eighteen points. But in 1976, when Democratic challenger Jimmy Carter defeated President Ford, the gap was less than ONE point. In 1972, when Nixon won reelection in a landslide, the gender gap was only three points.

The largest gender gap recorded by exit polling came in the 2000 election, where Gore carried women by ten points, while Bush carried men by eleven.

Yet in an election year where the most likely Republican nominee happens to have a knack for disparaging women, and where the probable Democratic nominee elicits an almost instinctual disdain from her male detractors, you have the recipe for a gender-gap explosion that could make the 2012 election, or even the 2000 contest, seem tame.

In fact, if current polling is any indication, that's exactly where we are headed.

Using national general election surveys released this year and compiled by Real Clear Politics, the average gender-gap across eight surveys is twenty-seven points. That's nearly ten points higher than the gender-gap seen in 2012, five points higher than the largest gender-gap ever recorded in a presidential election, and fourteen points higher than the average gender-gap in presidential elections since 1972. See below:

Friday, March 4, 2016

No, Trump Is Not Unusually Strong Among Democrats - But He IS Unusually Weak Among Republicans


From Mitt Romney's past dalliance with government healthcare and abortion, to John McCain's involvement with campaign finance and immigration reform, strict purity to conservative orthodoxy has never been a Republican prerequisite for the presidential nomination. But if Romney and McCain flirted with expanding the bounds of acceptable disobedience to GOP principles, Donald Trump has blown the lid off those bounds.

It started before he even officially entered the race last June, when Trump implored attendees at a Republican summit in April to resist reforming Social Security and Medicare. During the first GOP primary debate on August 6, 2015, Trump expressed admiration for Canada and Scotland's single-payer healthcare system. A few days later, Trump defended Planned Parenthood during an interview with Sean Hannity. Two weeks later, Trump suggested during a CNN interview that he would raise taxes on wealthy Americans, cleverly labeling it a hedge-fund tax. The following month, Trump signaled his disdain for free trade during a '60 Minutes' interview, telling Scott Pelley NAFTA has been a "disaster."  Believe it or not, the list goes on, but I digress.

Naturally, the historical nature of a Republican's brazen appeals to populist economic programs often identified with progressives led many political commentators to entertain an interesting theory: might Mr. Trump's overtures to the left pay dividends this November? Articles from Breitbart's Mike Flynn and The Washington Post's Philip Bump highlight Trump's support from a specific kind of Democrat - namely, ex-Democrats. The NY Times' hypothesis was a bit different, though not far off - a big chunk of Trump's support stems from self-identifying Republicans who, for whatever reason, are registered Democrats.

Regardless of the theory, beware of misleading headlines suggesting Trump could coast to victory in November on the backs of Democrats; because from the standpoint of general election polling, nothing appears nearly so out-of-the-ordinary. In fact, considering the eight national general election polls (with readily available crosstabs) conducted since the Iowa Caucus on February 1, Trump earns an average of just 9% from self-identified Democrats - essentially the same amount won by his GOP opponents Marco Rubio (9%) and Ted Cruz (8%). In fact, Mitt Romney, John McCain, and George W. Bush all polled better among Demo.crats than Trump during a similar period in their respective 2012, 2008, and 2004 (uncontested) primaries.

Not only that, but it's Marco Rubio - not Donald Trump - who holds Clinton to her lowest share of the Democratic vote. She wins, on average, 84% of Democrats in post-Iowa general election polling, while winning 85% and 86% against Donald Trump and Ted Cruz, respectively. See the table below:

Thursday, February 25, 2016

Trump vs. Rubio vs. Cruz In The Electoral College - Who Beats Clinton?

Getty image
As the 2016 presidential race progresses, I've given in and decided to try my hand at a bit of electoral projection. True, I'm playing in a crowded field with bigger and better players, but this is mostly for me. Plus, everyone needs a hobby.

For starters, this projection will be purely electoral college based, relying entirely on polling and nothing else, as opposed to say FiveThirtyEight, which employs a nifty "polling plus" forecast. Why not just rely on Pollster, or Real Clear Politics, you might ask? While both sites are exemplary, RCP excludes some surveys, and Pollster has yet to start projections for individual states in the general election - not to mention both sites aren't quite as up-to-date with the latest polling information as I would like them to be.

At least for now, each state's electoral college projection will be based on every state poll released in the last two months. For example, today's update would be based on polling dating back to December 25, 2015. Obviously, as the pace of general election polling picks up through the rest of the year, the projection will be based on a smaller time frame.

Since we're still nine months from the presidential race, very little general election polling has been done in most states, while other states have seen no polling at all. Regarding states that have not had any polls conducted over the last two months, the electoral college projection will be based on an average of the most recent survey conducted after Trump's June 2015 presidential announcement, and any survey conducted within one month of that most recent poll. If there has been NO polling post Trump-announcement, the electoral college projection will be based on an average of that state's 2004 and 2012 presidential election results. I've chosen 2004 and 2012 as a baseline in the absence of any polling because these two elections featured a relatively moderate-to-small win for the two political parties - the Republicans won by 2.5 nationally in 2004, while the Democrats won by 3.9 points in 2012.

Electoral college projections will be made for the three most likely GOP nominees (Trump, Rubio, and Cruz) using various shades of blue (for Democrats) and red (for Republicans), based on the Republican candidate's lead or deficit against the Democratic candidate. For example, the darker the shade of red, the stronger the Republican's lead against Hillary Clinton. The lighter the shade of blue, the smaller Hillary Clinton's advantage against the Republican candidate. For an illustration, see the map below:

Pink = GOP lead of less than five points. Light red = GOP lead of five to just-under ten points. Red = GOP lead of ten to just-under twenty points. Dark red = GOP lead of twenty points or more.
Very light blue = Democratic lead of less than five points. Light blue = Democratic lead of five to just-under ten points. Blue = Democratic lead of ten to just-under twenty points. Dark blue = Democratic lead of twenty points or more.

Now, on to the projections...starting with the strongest Republican candidate, based on current polling:

Friday, February 19, 2016

Post-New Hampshire Primary Polling Suggests Trump's Historically Well Positioned To Capture GOP Nomination

Photos, from left to right, courtesy of Getty Images, Carlos Osorio/AP, and Mike Segar/Reuters

To the chagrin of the sixty-to-seventy-odd percent of Republicans who do not support Donald Trump as their nominee for president, the billionaire firebrand is looking mighty dominant in post-New Hampshire primary polling. But how is he standing up compared to past polling front-runners at this point in the campaign? For Trump critics, the news is pretty bleak, yet not without at least a faint glint of hope.

In my experience, it's always best to start with the bad news, so here goes:  in nearly every presidential primary since 1976, the national polling leader between the New Hampshire and South Carolina primaries has gone on to become their party's nominee. Specifically, of the fifteen post-New Hampshire national primary polling leaders examined over the last forty years, twelve eventually earned their party's nomination (or 80% of the time).

Having said that, Donald Trump is currently the Republican's national polling leader, and by a wide margin. With one day remaining until South Carolinians head to the polls, Trump's averaging 36% support from Republicans across seven primary surveys conducted after the New Hampshire primary, reaching as high as 41% and as low as 26%. He maintains an average seventeen point advantage over his next closest competitor, Ted Cruz.

Faced with the numbers, and what we know of history, what else is there to conclude other than the fact that Trump appears headed for the Republican nomination?

Thursday, February 4, 2016

Iowa Entrance Poll Finding: Democratic Caucus-Goers Lurch Sharply Leftward in 2016, Republicans Less Conservative

Photo by Joe Raedle/Getty Images

An unquestionable, and entirely predictable ideological shift in the Democratic Party was confirmed by the Iowa entrance poll on Monday night. The first such poll to be conducted in eight years revealed that Democrats, or at least those willing to turn out for a night time caucus in Iowa, have become decidedly more liberal since their last meeting in 2008.

The fact was captured not only in the final vote count, which found a self-professed socialist virtually tied with a former Iraq War supporter, but turned up in black and white in the poll taken of Iowa Democrats as they entered their caucus site.

To be sure, there was an abundance of evidence that the Democratic Party was shifting ideologically leftward prior to the Iowa entrance poll. Since Bernie's campaign announcement last April, multiple surveys found a plurality of Democrats viewing socialism favorably - even more favorably then their views of capitalism. Routine political polling from the likes of Gallup and Pew Research also picked up on the increasingly liberal bent of the party. But caucus-goers confirmed the movement, and to an unmistakable degree.

Tuesday, July 14, 2015

Newsflash: Donald Trump's Poll Numbers Are Brutal, But That's Nothing New

Donald Trump peaked in 2011 national GOP primary polling at 26%. His best performance this year is 16%. Photo courtesy of Charlie Leight/2015 Getty Images.

Much to the chagrin of a large number of right-leaning political pundits, business mogul Donald Trump is polling well enough nationally among Republican primary voters to land himself in the top tier of candidates, whether the so-called "Establishment" likes it or not.

Yes. With one of the most crowded primary fields in history, as well as one of the most hyped, it's the notoriously bombastic and combative Donald Trump who is surging among the GOP.  And as surprising as it may seem, it shouldn't be. After all, we've been down this road before.

Very little has changed in the last 30 years since The Donald first gave serious consideration to a presidential run. Everything is there: the ego, the far-fetched policy prescriptions, the exceedingly wild accusations and insults hurled against his opponents, the erratic behavior, but most relevant to this piece, his poor standing in American public opinion throughout the years.

Polling data from Trump's presidential flirtations before 2011 is hard to come by. Though the limited amount I could retrieve indicated America's patience with Trump was only slightly higher than it is today.

As a result, the focus of this piece will be the comparison between Trump's polling performance in the first half of 2011, versus his performance so far this year. Spoiler alert: from a GOP horse-race perspective, Trump is looking very similar to how he did four years ago. His standing has worsened, however, from three different perspectives: 1) he's less popular with the general public, 2) he's less popular with primary voters, and 3) his general election standing looks worse.


No Love For Trump From The American Public

Since the start of this year, Trump has averaged a 27% favorability rating across nine state and national polls, with 62% saying they view him unfavorably. In national polling alone, he fairs even worse, averaging a 25/65% rating. An ABC/Washington Post survey taken shortly after Trump revealed he would be making a major campaign announcement on June 16 found an astounding 76% of registered voters saying they viewed Trump unfavorably. The same poll found that only 13% of voters could bring themselves to say they view Trump favorably, despite his near universal name recognition. His unfavorable rating exceeds his favorable rating in every poll of adults taken this year, by anywhere from 19-63 percentage points.


Wednesday, July 8, 2015

The Rise of Non-White Voters: Why The Racial Composition Of National 2016 Election Polls May Be Missing The Mark

Exit polling indicates that the non-white share of the electorate has increased by 2-4% in every presidential election since 1992. Picture courtesy of Jacquelyn Martin/A.P.

The Cook Political Report's Political Analyst David Wasserman recently tweeted the message below, regarding the likely racial make-up of the 2016 presidential election:


Wasserman's tweet revives a point made very shortly following the 2012 election, when I posited that based on demographic shifts since 1992, white voters could expect to make up anywhere between 68-70% of the 2016 electorate.  Why? Because the white share of the presidential vote has dropped between two and four points every cycle since 1992.

Well, the prognosticators at The Cook Political Report have spoken. And given their level of expertise in these matters, I'll happily give them the benefit of the doubt and go with their estimate - the 2016 electorate should be roughly 70% white, and 30% non-white.

Based on Wasserman's analysis, it might be a bit surprising to learn that the racial composition of some pollsters' surveys looks little like his assumption of the 2016 electorate. Democratic firm Public Policy Polling's most recent national survey found likely voters identifying as 74% white, and 26% non-white. If PPP's past success boils down to, what their director Tom Jensen called in 2013 "... a well informed but still not entirely empirical hunch," you have to wonder what less-than-empirical hunch led them to peg the 2016 electorate at 74% white, 26% nonwhite. These figures represent an even LESS racially diverse electorate than the one that showed up in the 2012 presidential election. And as I've already noted, the electorate has become MORE racially diverse in every presidential election since 1992. In other words, for the 2016 electorate to resemble PPP's racial composition, a major reversal of precedent is required.

Tuesday, June 30, 2015

Jeb vs. George: A Comparison Of The Bush Brothers' Pre-Primary Polling

Barbara Bush recently quipped that Jeb was not her favorite son. If pre-primary polling is any indication, he isn't America's favorite Bush, either. Photo courtesy of Eric Draper/AP.

Jeb Bush received welcome news last week from an NBC/WSJ poll finding him not only sitting atop the 2016 field in the Republican Primary, but the candidate most Republicans can see themselves supporting in the nominating contest. He's the strongest of three Republicans tested in a general election battle against likely opponent Hillary Clinton.

Great news for Bush diehards, right? Eh, it depends on who you are comparing him to. And if it's his brother, the news isn't so great.

George W. Bush led his likely Democratic opponent in the June 1999 NBC/WSJ poll by a significant 51-35% margin (according to Roper's iPoll database). Jeb actually trails his likely Democratic opponent 48-40%.

George W. also led his Republican primary opponents with a Hillary-esque 61% of the vote in the June 1999 NBC/WSJ poll. Elizabeth Dole was in a distant second at 11%. Jeb Bush attracts just 22%, and is within the margin of error of the second, third, and fourth place finishers.

Other pollsters during the same time period found George W. Bush hugely popular not just with Republicans, but with the general public overall. Jeb Bush is viewed unfavorably by more American adults than view him favorably, not to mention his relatively tepid ratings among members of the Republican base:

*YouGov/Economist poll numbers represent a monthly average of their weekly tracking poll.

Monday, June 8, 2015

The Silent Center: How Republican Moderates Have Come To Dominate Recent Presidential Primaries

Rick Santorum was the runner-up to the Republican nomination in 2012, as was Mike Huckabee in 2008. But if either contest had been limited to 'very conservative' primary voters only, they likely would have been the Republican nominees for President in their respective races. Photo is courtesy of Scott Olson/Getty Images.

Jeb Bush raised a few eyebrows last December when he stated that the eventual Republican nominee would have "to lose the primary to win the general without violating your principles." The seemingly paradoxical statement is an acknowledgement by Bush of the prevailing conventional wisdom in Republican presidential primaries - that Republican candidates damage their general election prospects by running right of mainstream America during the nominating contest. But more important, at least for the purpose of this article, was the implication that Republican candidates must beef up their conservative bona fides to win.

This second notion is popular among political pundits, making its way into piece after piece examining the historically large crop of potential 2016 GOP candidates for president. And it's nothing new. Mitt Romney perpetuated the notion with his "severely conservative" remark at the 2012 CPAC conference. John McCain's apparent insufficient conservatism was noted many times by pundits during the 2008 primary campaign. 

The inclination to jump on the "too moderate to win the primary" bandwagon feels almost instinctual, especially for a party with as vocal of a strongly conservative faction as the Republicans. Yet an analysis of exit poll results from the 2012 and 2008 Republican primaries demands a different conclusion. No - the overall Republican primary electorate is not averse to an admittedly moderate candidate. Far from it, in fact.

Why? Because exit polling has indicated that self-identified moderates/liberals and 'somewhat conservative' voters greatly outnumber the far-right of the primary electorate.

By combining the results of the twenty states to feature an exit poll in the 2012 Republican primary, we find that self-described moderates and/or liberals comprised 33.3% of the national electorate, 33.1% identified as 'somewhat conservative,' and 33.5% identified as 'very conservative.' In other words, the GOP's self-described ideology fits very nicely into thirds.

Red cells highlight states where self-identified moderates/liberals made up a plurality of the Republican primary electorate. Data in the table is courtesy of Dave Leip's US Election Atlas and NBC News 2012 Republican Primary Exit Poll Results.


Tuesday, March 24, 2015

Polling Update: Hillary Clinton's Image Dinged In Wake of Email Scandal, Though The Injuries Are Minor

Photo courtesy of Yana Paskova/Getty Images

In the seemingly never-ending spectacle that is the modern day presidential campaign, the month of March 2015 will likely be remembered for the New York Times story revealing Hillary Clinton skirted State Department rules requiring work-related email retention. The fact that the former New York Senator was conducting government business over a private, in-home family email server dominated 2016 news for days afterwards. Naturally, three weeks into this story, the headlines and questions have taken a toll on Clinton's image.

The days of soaring, rockstar-like favorability ratings have come to an end for Mrs. Clinton (though this trend was emerging even before 'emailgate'). In fact, her post-scandal numbers more closely resemble the contentious days of the 2008 Democratic Primary than the lofty highs from her stint as Secretary of State.

Of the nine surveys to measure Clinton's favorability rating before and after the email scandal broke, all but one found her net favorable rating had dropped in its aftermath. The one that did not was conducted March 1-5, even though the email story broke late in the day on March 2, and didn't reach peak media fervor until days later. The poll was also completed five days before Hillary's largely-panned press conference on March 10.

Beyond the NBC/WSJ poll, Clinton's net favorable rating dropped anywhere from six to twenty-four points before and after the story broke. Economist/YouGov has taken two polls since the Clinton scandal broke, and has measured the smallest drop (from 52/44% on July 7-10, 2014, to an average 48/46% post-controversy).


The post-controversy Economist/YouGov numbers represent an average of two surveys, one conducted on March 14-16 and March 21-23, 2015.

Public Policy Polling, of all pollsters, measured Hillary's largest favorability drop. Granted, their pre-email story survey is two years old. Regardless, a 56/37% to 43/48% drop is stark nonetheless.

Clinton averaged a 52/38% favorable/unfavorable rating among pollsters that tested her favorability both before and after the email story. She averaged 46/43% after the story broke.

Other pollsters measured the effect of the email story on Hillary's public image in different ways, and the results are more mixed for the former First Lady.

Economist/YouGov, for example, conducted extensive post-email polling on Clinton, and found doubts about her sincerity up sharply from last year.

On the other hand, a Republican pollster found that just 36% of Americans have a less favorable view Mrs. Clinton as a result of the email scandal. Twenty-nine percent say the same in a recent CBS News survey. For comparison, 45% held a less favorable view of Mitt Romney as a result of the infamous "47%" remark in the early fall of 2012. Thirty-two percent felt the same about Barack Obama's 'You didn't build that' remark earlier that same year.

Furthermore, Hillary's outstanding numbers in the 2016 Democratic Primary are still in great shape:

*The pre-email scandal PPP poll in Wisconsin included former home-state Senator Russ Feingold as a 2016 Democratic Presidential primary candidate, while the post-email scandal survey did not. ^The post-controversy Economist/YouGov numbers represent an average of two surveys, one conducted on March 14-16 and March 21-23, 2015.

And while Mrs. Clinton's lead over her potential 2016 GOP contenders dropped across the board in the latest CNN poll, she still maintains double-digit leads against all of them.

It may sound fair to say the Clinton's are nothing if not deceitful. But as they've shown time and time again, they are resilient as well. While emailgate has undoubtedly been unhelpful for Hillaryland, it's not as bad as it could be, and seems far from fatal. Absent new information, Clinton will survive with minor scrapes and bruises.


Updated on March 25 to include new St. Leo University, PPP, Economist/YouGov, and CBS News polls. 

Thursday, March 12, 2015

Operation Chaos Part Two? What The Lack Of A 2016 Democratic Primary Could Mean For The Republican Contest

These two men may not share much in common, but both were the prime beneficiaries of independent and Democratic votes in their respective Republican presidential primary bids. Photo courtesy of AP/Dennis Cook.

A recent piece featured in U.S. News & World Report by The Run 2016 founder Dave Catanese briefly examined the effects of a non-existent Democratic Presidential primary on a competitive GOP nominating contest.  His focus was New Hampshire, where self-identified independents make up a larger than average share of both the Republican and Democratic electorates. Catanese's suggestion is that with Clinton virtually clearing the Democratic field, the Granite State's independent base will flock to the Republican primary.

Exit polling indicates Catanese is correct. In 2008, when both political parties were deep in the throes of competitive contests, self-identified independents and Democrats made up 39% of New Hampshire Republican Primary voters. Four years later, with President Obama running unopposed on the Democratic side, independents and Democrats, as a percentage of voters, jumped twelve points to 51%.

To be fair, this anomaly isn't limited solely to the Granite State. In Iowa, independents and Democrats jumped from just 14% of GOP caucus-goers in 2008 (when both Republican and Democratic primaries were competitive), to 25% in 2012 (when Obama ran unopposed).

The number of non-Republicans voting in the GOP nominating contest increased from 2008 in sixteen of the twenty states that conducted exit polling in 2012, or 80% of the time.

Why the sharp increase? Absent a uniform national 'open primary' movement, the lack of a competitive primary on the Democratic side seems like the obvious culprit.

Based on data compiled from the twenty-seven states to feature an exit poll in the 2008 GOP primary, and final vote counts provided by Dave Leip's US Election Atlas, self-identified Republicans made up 76% of the Republican primary electorate, independents made up 20%, and Democrats made up 3%. All total, those who identified as something other than a Republican made up 24% of the national electorate.


In 2012, with all eyes on the GOP contest, Republicans dropped to just 70% of the primary electorate, versus 26% who identified as independent, and 5% who identified as a Democrat. That's a total of 30% of GOP primary voters who identified themselves as something other than a Republican. Again, these numbers are based on the twenty-states that conducted exit polling in the 2012 GOP primary.


Red cells highlight states where self-identified Republicans failed to make up more than a majority of the electorate.