

Thursday, November 29, 2012
2013 VA. Gov: With Warner (D) & Bolling (R) out, looks like McAuliffe (D) vs. Cuccinelli (R)
Wednesday, November 28, 2012
UPDATE: Christie vs. Booker, New Jersey Governor's race 2013

Yesterday I proposed that Cory Booker may not want to give up yet on the NJ Governorship in 2013, considering Christie's inflated numbers with Democrats and Independents in the wake of Hurricane Sandy in a new Rutgers-Eagleton poll.
Today, Quinnipiac released their own poll on a hypothetical Booker v. Christie race, and found nearly the exact same result as Rutgers; Christie leads 53-35% (he led 53-34% in the Rutgers poll). Also like the Rutgers poll, Christie is dominating among Republicans and Independents, while siphoning off a fair number of Democrats - 20%, to be exact (26% in the Rutgers poll).
But like last night's post, the results look a bit different in the event Booker is able to do at least as well among Democrats as John Corzine (D) in 2009. The Rutgers poll showing Christie up 53-34% became a 2 point Booker lead (46-44%) if the poll is reweighted to show Booker receiving 86% of the Democratic vote (the percentage obtained by Corzine in '09). Does the same thing happen to the Quinnipiac poll when reweighted to Corzines '09 numbers?:
Tuesday, November 27, 2012
Why Cory Booker may want to give the 2013 NJ Governor's race another glance

Once thought to be somewhat vulnerable to a challenge from a strong Democrat, Chris Christie now leads all of his challengers by at least 19 points, including the much hyped, rising Democratic star, Cory Booker. A new Rutgers-Eagleton poll of New Jersey, taken Nov 14-17, shows the boisterous New Jersey Governor receiving a 19 point bounce in his personal favorability rating following a mega-storm that left millions throughout the northeast stranded and without power. Just one month earlier, before Sandy struck, and 1 month after his keynote speech at the RNC, Christie was barely above water with New Jersey voters. His favorability rating was an unimpressive 48/42%, and more voters said they'd rather NOT reelect him (47-44%). Seven weeks later, and Christie's favorability rating has surged to 67/25%, representing a net 36 point net increase. Now, Voters DO want to see him reelected, 59-32%, and a recent Fairleigh Dickinson poll shows his job approval rating at 77%.
Monday, November 26, 2012
2012 Youth Vote: Anomaly or permanent Democratic voting bloc?
 P
P18-29 yr-old voting patters, 1976-2012

2016 Democratic primary: Absent Hillary, no clear front-runner in New Hampshire
"Given the choices of Joe Biden, Hillary Clinton, Andrew Cuomo, Martin O’Malley, Deval Patrick, Brian Schweitzer, Mark Warner, and Elizabeth Warren, who would you most like to see as the Democratic candidate for President in 2016?
- Hillary Clinton 60%
- Joe Biden 10%
- Andrew Cuomo 7%
- Elizabeth Warren 4%
- Deval Patrick 3%
- Martin O'Malley 0%
- Brian Schweitzer 0%
- Mark Warner 0%
- Someone else/Not sure 15%"
Sunday, November 25, 2012
ELECTION 2012: State-by-state changes in party I.D.

While national partisan identification may have shifted 1 point from the 2008 election to the 2012 election, that spread wasn't consistent everywhere. Some states saw larger shifts than others, usually in favor of the Republicans, but certainly not always. Nationally, 38% of voters identified as Democrats (down 1 pt from 2008), 32% identified as Republicans (same as 2008), and 29% identified as Independent (also, same as 2008).
Below is a chart showing the shift in national party ID per state since 2008. Note that some states are missing due to the "National Election Pool's" decision to cut back on exit polling in 2012 as a cost saving measure. As a result, on 31 states featured exit poll results, as opposed to all 50 states in 2008.
Wednesday, November 21, 2012
Rick Santorum's rough road to the 2016 nomination

A new article from the Christian Post reports that an anonymous evangelical leader close to the Santorum team has confided that the 2012 GOP runner-up is taking steps to run in 2016:
"Rick's getting ready [sic] organized and is not going to be behind the eight-ball when it comes to fundraising and building a grassroots organization," the anonymous source said. "I think you'll see and hear a lot from Rick in the next 12 months."
Tuesday, November 20, 2012
The likely make-up of the 2016 Iowa Caucus electorate could determine who runs
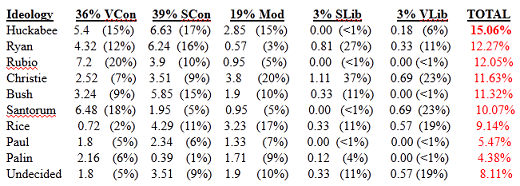
The Republican field in 2016 looks wide-open for the moment, according to Public Policy Polling (D). In newly released polls of Iowa, New Hampshire, and Florida, politicos ranging from Mike Huckabee, to Chris Christie, to Jeb Bush come out at the top of the pack. With the Iowa Caucuses just three years away, lets take a look at some different turnout scenarios based on past exit polling. The information below provides a more detailed look at the Iowa PPP results, extrapolated from their ideological I.D. findings.
PPP results extrapolated from Ideological I.D. findings:
"VCon"= very conservative; "SCon" = somewhat conservative; "Mod" = moderate; "SLib" = somewhat liberal; "VLib" = very liberal
PPP results extrapolated from Ideological I.D. findings:
"VCon"= very conservative; "SCon" = somewhat conservative; "Mod" = moderate; "SLib" = somewhat liberal; "VLib" = very liberal
How Exit Polls changed as election night wore on

One interesting feature of the 2012 general election is the fact that historically unreliable EARLY exit poll data actually proved to be more favorable to Romney than Obama, going against the popular notion that early numbers tend to favor Democrats. Several metrics, ranging from Party ID, to views of government, to race/ethnicity showed more promising numbers for Romney earlier in the night, only to magically change as more and more returns were actually counted.
For example, just two hours before the first polls closed on the East Coast, politico reporter Jamie Dupree tweeted the following:
"41% say the government should do more - 53% say the government is doing too much; it was flipped 51-43 in 2008"
But by the time the night was over, that 12 point lead for those thinking the government is doing TOO much had dwindled to just an 8 point, 51-43% lead.
Jon Karl of ABC News also provided some flawed preliminary exit poll data. See these tweets from just before 6 pm E.S.T., election night 2012:
"In two ABC prelim exit polls, Romney slightly edges Obama on handling of the economy and the deficit (51-47 and 50-46 percent)"
"In our ABC preliminary exit poll, voters give Obama the edge over Romney on who is more in touch with them (52-44)"What were the actual numbers? In the end, Romney's edge over Obama on the economy and deficit was NOT the 4 points early exit data indicated. In fact, it wound up being just 1 point, 49-48%, and just 2 points on the budget deficit (49-47%). Meanwhile, the number who felt the President was more in touch with them than Romney grew from an 8 point deficit to a ten point deficit (53-43% for Obama).
The difference between early, preliminary exit poll data, and the final result was evident in several other places, but perhaps none more consequential than partisan identification. At about 6:05pm, E.S.T., one hour before the first polls closed on the East Coast, CNN provided viewers with (and I tweeted) the preliminary Party ID data:
Monday, November 12, 2012
2016 Not Looking Any Better for Republicans

Days before the polls closed on November 6, 2012, the Obama team was predicting publicly that the electorate would be less white than in 2008, and they were right. Their argument went like this:
"Since the campaign began, Team Obama has assumed that whites would make up 72% of voters, down from 74% in 2008. (The logic: This percentage has decreased in every U.S. election, and the minority population continues to grow.) On the other hand, Republicans counter that due to greater GOP enthusiasm, the white percentage could very well stay the same as in 2008 -- or even be a tick higher. And according to our NBC/WSJ pollsters, the final outcome here could sway the election. If you assume that both sides maximize their margins (Romney wins whites by 20 percentage points and Obama wins minority voters by 60 percentage points), whites making up 75% of the electorate would give Romney the edge with the popular vote by a fraction of a point. But if the white percentage is 74%, Obama would win the popular vote by a fraction of a point. And if it’s 73%, Obama wins by one point. Bottom line: Watch the white percentage in tomorrow night’s exit polls; it will tell you more about where Virginia or Iowa or Colorado or Wisconsin will go."
Seems awfully prophetic in retrospect.
Further evidence that something has to do be done about the GOP / non-white voter divide

Mitt Romney won a larger percentage of the white vote than George W. Bush in 2004, but that wasn't enough to overcome massive deficits with non-white voters. Perhaps the best example of this lies with the Latino vote. Romney lost the third largest voting block by an astonishing 44 points (71-27%). Compare this to 2004, when Bush ran just 9 points behind John Kerry among a group that made up 8% of the electorate (44-53%). Or compare it to the 2008 Democratic landslide in which McCain lost the Latino vote by 36 points, or 67-31%.
Considering that current tallies have the national popular vote at about 50.6% for Obama, and 47.8% for Romney, how well would Mitt Romney have had to do with Latinos in order to overcome Obama in the national popular vote?
Wednesday, November 7, 2012
A look at 2012 Demographics
Myself and others speculated that if the GOP won white voters by about 20 points or more, that would offset any gains for Democrats from white turnout being held at 2008 levels (when they made up 74% of the electorate). And indeed, Romney performed much better among white voters than John McCain four years earlier, winning the largest voting block 59-39%. McCain only carried the group by 12%.
But what many did not count on (myself included) was a full 2% drop in the number of white voters in the electorate. That, coupled with 2008-like African American turnout, increased Latino turnout, and a stronger Obama margin with Latinos led to Romney's demise.
But what many did not count on (myself included) was a full 2% drop in the number of white voters in the electorate. That, coupled with 2008-like African American turnout, increased Latino turnout, and a stronger Obama margin with Latinos led to Romney's demise.
Subscribe to:
Posts (Atom)