Showing posts with label Paul Ryan. Show all posts
Thursday, January 30, 2014
Republicans TIE Hillary Clinton In Latest 2016 Poll, Though Demographics Point To Friendly GOP Electoral Landscape
There's good and bad news for both Democrats and Republicans in the new 2016 national survey from the pollster liberals love and conservatives love to hate, the occasionally accurate and always trolling Public Policy Polling.
The bad news for Republicans is their previous standard-bearer, Chris Christie, continues to take a beating in the polls for the "bridgegate" scandal. The New Jersey Governor was a fairly rare political figure for this day and age where everyone seems to hate anyone and anything associated with politics and Washington D.C. He had a double-digit positive favorability rating that stretched across party lines. But over the course of just one month, Christie's favorability rating dropped from the best of the field (43/31%) to THE worst (31/46%; even lightning rod Tea Partier Ted Cruz manages a -10% net rating). Having previously led Hillary Clinton by 3-pts (45-42%), Christie now trails by 2-pts (45-43%).
What's more, the entire Republican field looks pretty unpopular nationally. The most popular potential GOP candidate, Mike Huckabee, could only manage a 37% favorability rating. And even then, his unfavorable rating was slightly higher at 38%. The rest of the field ranges from a net favorability rating of -6% (Paul Ryan) to -15% (Chris Christie).
The good news, however, is that despite all of this, every Republican tested looks like they could be competitive in a national race against Hillary Clinton in 2016. All of them except Ted Cruz poll within the margin of error of Hillary (3.4%). And Christie, the GOP's most unpopular candidate at the moment, leads Joe Biden and Elizabeth Warren by significant margins.
The bad news for Democrats is that like the Republicans, their standard bearer has also fallen in the court of public opinion. Hillary Clinton's favorability entered negative territory for the first time in a PPP survey in years. And potential primary competitors Sen. Elizabeth Warren and Vice President Joe Biden look particularly weak.
The good news for Democrats isn't readily obvious on the face of the poll. But they can find a little relief by pulling back the curtains and examining the crosstabs, for PPP is finding a much more friendly GOP climate than existed in either the 2012 or 2008 presidential elections. In fact, at least two of their more significant demographic findings (race and age) much more closely resemble the 2010 midterm electorate, when Republicans picked up a nearly unprecedented number of House seats and carried the popular vote handily.
Consider PPP's race findings, in which 3/4 of poll respondents identify as white, the highest amount since the 2004 presidential election. We know from examining every presidential election since 1992 that the white share of the vote has dropped from 4% to 2% per cycle. If that tradition holds in 2016, we could expect the white share of the total electorate to be between 68-70% (it was 72% in 2012). For comparison, CNN exit polls showed that white voters made up 77% of the vote in the 2010 midterm election. Likewise, Hispanic voters have seen their share of the electorate increase in every presidential election since 1992 (between 3% and 1% per cycle). In 2012, they made up 10% of voters. By that standard, you'd expect Hispanics to make up between 11-13% of a 2016 presidential electorate, and not the 9% found by PPP (which is much more similar to the 8% found by exit polls in 2010). The African American and Asian share of the vote hasn't increased in ALL of the presidential cycles, but has been on a general upward trend of late.
So I'd posit that the 75 / 12 / 9 / 4% white/black/Hispanic/Asian-Other finding from PPP's national survey is less reflective of a likely 2016 presidential electorate than, say, a 69 / 13 / 12 / 6% finding. Had this been PPP's racial identification finding, Hillary Clinton's narrow margins over her Republican competitors naturally grows (as Democrats have historically performed stronger with minority than white voters). The chart below documents what the PPP results would have been had they found the more racially diverse electorate described above, all other findings remaining the same:
Tuesday, August 13, 2013
A Peculiar Disconnect Between PPP's Early State & National 2016 Polling
In what had to be considered excellent news for Democrats across the country last week, another PPP 2016 survey in loyally Republican Georgia shows Hillary Clinton amazingly competitive in what has typically been unfriendly territory for Democrats, and Hillary Clinton personally.
Democrats haven't won in Georgia at a presidential level since Bill Clinton's narrow half-point victory in 1992. Before that, it was native son Jimmy Carter in 1980. As for Hillary, though she's never faced the Georgia general electorate, her own party wasn't very kind to her on the only occasion she's ever had to run on their statewide ballot (losing to Barack Obama in the 2008 Democratic primary by 35 points).
But that could all change in 2016 if Public Policy Polling's state surveys are on the mark. For the second time this year, Hillary Clinton essentially TIES or LEADS all of her likely Republican competitors in the largest state of the Deep South:
Those would be very impressive numbers for any Democrat, especially considering Barack Obama lost the state by 8 and 5 points in 2012 and 2008, while John Kerry and Al Gore lost the state by 17 and 12 points in 2004 and 2000.
But the Georgia numbers caught the eye of at least one pollster for another reason - how exactly could Hillary Clinton be performing so well in Georgia, while finding herself in a tie with most of her GOP opponents in a NATIONAL survey from the same polling company just two weeks prior?
Consider this: in each of the last four presidential elections (2000-2012), the state of Georgia has voted about a net 12 points more for the Republican over the Democrat than the nation as a whole. For example, while Barack Obama carried the national popular vote by a margin of 4 points in 2012, Mitt Romney won Georgia by 8 points.
Obama dispensed of McCain nationwide by 7 points in 2008, while McCain still managed to carry Georgia by 5.
Friday, August 2, 2013
Paul Ryan: Beloved By Republican Primary Voters, But Not Their Pick For President
![]() |
| Rep. Paul Ryan is the most popular of all 2016 Republican Presidential candidates in terms of favorability, but lags in horse-race polling. |
Congressman Paul Ryan, the young, wonky, slightly-awkward Wisconsin Congressman and most recent Republican Vice Presidential nominee has had his ups and downs since the start of the 2012 Presidential cycle. After what were surely flattering entreaties from his party to enter the race for the White House that year, he was picked from a large and impressive line-up of Republican politicians as one-half of the Presidential ticket with Mitt Romney.
Despite a close race, the Romney-Ryan ticket lost to Obama-Biden by a disappointing 51-47%. Both men appeared shell-shocked.
The undeniable disappointment on behalf of Republican voters and punditry at the result took a slight toll on the House Budget Committee Chairman's personal popularity. He saw a net positive favorability rating pre-2012 election turn negative afterwards.
In the 13 national surveys of Ryan's favorability since November 2012, only four of them found him with a higher favorable than unfavorable percentage. Since November 2012, he averages a 39% favorable rating, and a 41% unfavorable rating.
But while Ryan may need a little rehabilitation on his image with general election voters before running for President (which he has not ruled out), he's as beloved as ever by Republican primary voters, as a recent Pew Research poll made clear:
According to Pew, 2/3 of Republicans and Republican leaners view Ryan favorably, putting him in a very comfortable position when compared to other likely 2016 GOP contenders (Rand Paul is viewed favorably by just over half of Republicans, Marco Rubio by half, and Chris Christie by 47%).
Fortunately for Ryan, the Pew finding showing him the most popular 2016 GOPer is replicated in ALL TEN post-2012 election surveys of Republicans and/or GOP primary voters. In every single survey, Ryan's favorability score exceeds all other Republicans.
The data in the table below shows the average favorability rating of every potential major 2016 GOP primary candidate since the 2012 election:
![]() |
| All surveys used in the averages can be found here. |
For whatever reason (which must at least partially include name recognition), Ryan leads a pretty impressive list of potential candidates in terms of favorability, while the nationally popular Chris Christie ranks 2nd to LAST, behind the uber-socially conservative Rick Santorum, and the humiliated Rick Perry.
That's why some might be surprised to learn that despite all the love from his party, Ryan's not performing all that well in the early 2016 primary horse-race. In fact, in an average of all primary surveys since the presidential election, Ryan finishes third, behind Marco Rubio and Chris Christie:
Sunday, July 28, 2013
Democratic Pollster finds 2016 Republican Candidates Nipping At Hillary's Heels
![]() |
| Photos courtesy of Donkeyhotey |
Despite signs of shocking strength in Public Policy Polling 2016 state surveys earlier this year, the unquestionable front-runner for the Democratic nomination is seeing less success at a national level, especially considering the most recent numbers from the left-leaning NC based pollster:
So Gov. Chris Christie, fmr. VP nominee Paul Ryan, and President Bush's brother Jeb are all essentially tied with Hillary Clinton. Marco Rubio is within the margin of error, and Rand Paul is within 10 points of her.
What's going on here? I thought Hillary was unstoppable, poised to not only win by double digits in the general election against all of her potential opponents, but poised to start picking off traditionally red states in a fashion not seen since the '84 Reagan landslide.
In fact, just as recently as May, PPP found a considerably stronger Hillary Clinton that led Marco Rubio and Rand Paul by double-digits, and Chris Christie by 3 points. And in PPP's first 2016 poll from January, Clinton led Jeb Bush and Paul Ryan by 14 points. See the chart below:
But the most recent PPP poll is notable not simply because of how well the Republican candidates perform against Clinton relative to previous PPP surveys, but also how they perform relative to all other 2016 polling to date:
Marist was the last non-PPP pollster to survey the 2016 Presidential race, and they did NOT find any of the Republican candidates tied with Clinton. Christie only managed 41% to Clinton's 47%. And it only gets worse from there for the rest. Paul Ryan, who trailed Hillary Clinton by just two points in the PPP poll, finds himself a whopping 16 points behind the Democratic frontrunner. Jeb Bush trailed Hillary by a 8 points (as opposed to 3 points in the PPP poll), and Rubio, Paul, and Perry were all down double digits.
Quinnipiac found similar results in late June and May, with Christie down 6 to Clinton, Bush down 8, and Paul down double-digits. And as far back as March, Quinnipiac had Clinton ahead of Christie by 8, Ryan by 12, and Rubio by 16. So as you can see, the recent PPP numbers represent quite a shift from the start of the year.
Pulling back the curtains on the poll results, we see some interesting racial splits among various 2016 match-ups. For example, NONE of the GOP candidates perform as well with white voters as Romney did in 2012, when he defeated Obama 59-39%. In fact, only Chris Christie and Paul Ryan manage to win whites by double digits against Hillary (by 12 and 11 points, respectively), lending credence to the notion advanced by some that Republicans will have trouble repeating their 2012 performance with white voters against a Democrat who is not an African American. Also notable is the fact that Hillary Clinton is able to keep Rand Paul limited to a 6 point advantage (46-40%) among white voters.
Wednesday, March 27, 2013
Hillary Tops 70% With Moderates Against Home-Stater Marco Rubio In Recent Florida Poll
![]() |
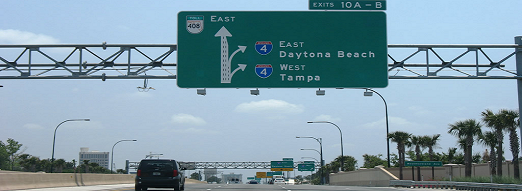
| The I-4 Corridor, which runs West-to-East across the Florida peninsula, connecting Orlando and Tampa, is one of the most sought after swing-regions within a "swing-state" in the country. |
As I wrote yesterday, Public Policy Polling has a new 2016 poll on the perennial swing-state of Florida. But their swing-state status won't look all that "perennial" if Hillary Clinton has anything to say about it. She leads 3 likely 2016 GOP contenders, former VP nominee Paul Ryan (54-41%), ex-Gov. Jeb Bush (53-40%), and Sen. Marco Rubio (56-40%), demolishing them among Independent AND Moderate voters.
Yes, Hillary Clinton leads two reasonably popular HOME-STATE politicians...by double digits...in a state that hasn't seen a presidential candidate win by such a margin since 1988 (and even then, it was a Republican that accomplished the feat).
If PPP's results are actually borne out, Hillary would far outpace her husband's 48-42% victory over Bob Dole in 1996, the highest winning margin of any Democrat in Florida since exit polling became easily available in 1976. She would make Obama's back-to-back 50-49% & 51-48% wins in 2012 & 2008 look like the work of a political amateur. Her margin over the 3 Republicans in Florida looks the most similar to Ronald Reagan's performance in the state in 1980 (which he captured from Jimmy Carter, 56-39%).
To better understand the significance of a potential double-digit Florida win for Hillary, consider the chart below of Florida presidential election results since 1976:
Where exactly does Hillary's peculiar strength in such a quintessential swing-state stem from? The PPP cross tabs have her winning around 85% of self-identified "liberal voters," pretty close to Obama's numbers in the state against Romney last November. She manages about 20% of the "conservative" vote, also similar to Obama's 2012 margin.
Nothing in particular stands out until you glance at the vote break-down of "moderates." Hillary doesn't just beat the GOP. She wipes the floor with them:
- She's +47% with moderates in a hypo against Paul Ryan (69-22).
- She's +30% with moderates in a hypo against Jeb Bush (61-31).
- She's +48% with moderates in a hypo against Marco Rubio (71-23).
Monday, March 25, 2013
Moderate voters skew HEAVILY Democratic in PPP's 2016 polling
I consider myself to be pretty moderate on a number of policy issues, mostly social: abortion, immigration, gay marriage, the death penalty, separation of church and state. But if I were asked by an exit pollster my "ideology" on a scale of very conservative, somewhat conservative, moderate, liberal, or very liberal, I'd probably put myself in the somewhat conservative side of things. My views on taxation and the role of government in the economy shove me to the right. But there's a significant portion of the country that identifies their political ideology as "moderate" (41% to be exact). Who are these so-called "moderate voters" that typically make up the plurality of the presidential electorate, and how do they vote? Even more importantly, how will they vote in 2016?
If early Public Policy Polling surveys on 2016 are any indicator, Republicans will be STOMPED by Democrats among "moderates." In fact, the GOP is poised to win the LEAST amount of so-called "moderate voters" ever (or at least since exit polling began in 1976), especially if Hillary Clinton is their nominee. The chart below documents the moderate vote for Hillary Clinton vs. any GOP opponent in every national or state 2016 poll conducted by PPP over the last month. Unfortunately, the very few polling firms besides PPP that have already started surveying the 2016 race did not provide crosstabs for ideological breakdown. So the focus will be on PPP's results:
If you operate under the assumption that Conservatives vote Republican, Liberals vote Democrat, and Moderates split their vote, you'd be wrong, according to PPP...dead wrong. Hillary Clinton leads Paul Ryan, Chris Christie, Marco Rubio, Jeb Bush, Rick Santorum, Bobby Jindal, Newt Gingrich, and Scott Walker among moderates in every state & nat'l poll over the last month, by MASSIVE margins. In fact, the best that any Republican is able to do against Hillary among moderates is Paul Ryan's 57-32% deficit in the state of Pennsylvania. But even then, Hillary leads by 25 points. The WORST any Republican does with moderates is Marco Rubio in Michigan AND his home-state of Florida. Hillary leads him with moderate voters in both states, 65-16% and 71-23% respectively. That's border-line embarrassing for Rubio. To make it worse, Hillary has averaged a 63-25% lead over Republicans with moderates in PPP polling over the last month.
Tuesday, March 19, 2013
2016: Paul Ryan More Unpopular than Sarah Palin, John Edwards, and Joe Lieberman Were At This Point
Rasmussen Reports released their latest national survey on likely voter impressions of the would-be Vice President:
Only a little more than 1 in 3 likely voters view the young Wisconsin Congressman favorably, while a solid majority see him unfavorably. To be blunt, those are really awful numbers. We're talking Nancy Pelosi, Sarah Palin type numbers. But they're even worse in the context of where he once stood on Rasmussen Reports, as recently as just two and seven months ago:
Over the course of just two months, views of Paul Ryan have gone from being split evenly among the electorate, to tilting overwhelmingly unfavorable...at least, according to Rasmussen Reports. Where did his massive 16 point negative downturn since January come from? Ryan fell across the board, but most notably among Republicans. In fact, his drop among Republicans is so stark that you almost have to chalk it up to statistical error. For example, a whopping 40% of his own party views him unfavorably, with just 52% seeing him favorably. Compare that to his January Rasmussen rating, when his fav/unfav rating was a staggeringly high 76/14% among Republicans.
Even outside of Rasmussen Reports, you can detect a distinct downward trajectory since the election last November in Paul Ryan's favorability ratings. Perhaps his 'front-and-center' role in the nation's budget debate is to blame. Or perhaps it's due to the Democratic-created notion that Paul Ryan wants to end Medicare as we know it. Or perhaps it's simply his association with a failed presidential campaign. Either way, his post election favorability ratings have been worse than each of the 3 preceeding Vice Presidential losers before him, at a similar point in time following their election loss; the 3 VP nominees being Sarah Palin (R), John Edwards (D), and Joe Lieberman (D). The chart below averages the findings of every favorability survey on the four former VP nominees, from the time of their selection, until present day (or the equivalent thereof in 2009, 2005, and 2001). The full list of each nominee's favorable/unfavorable ratings can be found here, and was compiled from Pollster, TPM Poll tracker, Poll Report, and National Journal.
While all four of the most recent failed Vice Presidential candidates maintained overall positive favorability ratings from the time of their selection to this point in their post-VP run, Paul Ryan's rating remains the lowest, at just 41/40%. Consider the fact that both Joe Lieberman AND John Edwards (pre-love-child scandal, of course) maintained personal favorable ratings of +20 or more (44/15% and 46/26%, respectively). In short, Joe Lieberman was the most popular VP nominee of the last 4 elections, while Paul Ryan is the least (based on favorability ratings from the time of their selection to this point in their post-VP runs).
Do you have a favorable or unfavorable opinion of Paul Ryan? (nat'l survey of 1,000 likely voters conducted March 14-15, 2013)
Favorable: 35% (-8)*
Unfavorable: 54% (+8)
*Number in parentheses represent the percent-change in Ryan's favorable/unfavorable rating among likely voters nationwide since Rasmussen's previous poll on the race in January.
Only a little more than 1 in 3 likely voters view the young Wisconsin Congressman favorably, while a solid majority see him unfavorably. To be blunt, those are really awful numbers. We're talking Nancy Pelosi, Sarah Palin type numbers. But they're even worse in the context of where he once stood on Rasmussen Reports, as recently as just two and seven months ago:
Over the course of just two months, views of Paul Ryan have gone from being split evenly among the electorate, to tilting overwhelmingly unfavorable...at least, according to Rasmussen Reports. Where did his massive 16 point negative downturn since January come from? Ryan fell across the board, but most notably among Republicans. In fact, his drop among Republicans is so stark that you almost have to chalk it up to statistical error. For example, a whopping 40% of his own party views him unfavorably, with just 52% seeing him favorably. Compare that to his January Rasmussen rating, when his fav/unfav rating was a staggeringly high 76/14% among Republicans.
Even outside of Rasmussen Reports, you can detect a distinct downward trajectory since the election last November in Paul Ryan's favorability ratings. Perhaps his 'front-and-center' role in the nation's budget debate is to blame. Or perhaps it's due to the Democratic-created notion that Paul Ryan wants to end Medicare as we know it. Or perhaps it's simply his association with a failed presidential campaign. Either way, his post election favorability ratings have been worse than each of the 3 preceeding Vice Presidential losers before him, at a similar point in time following their election loss; the 3 VP nominees being Sarah Palin (R), John Edwards (D), and Joe Lieberman (D). The chart below averages the findings of every favorability survey on the four former VP nominees, from the time of their selection, until present day (or the equivalent thereof in 2009, 2005, and 2001). The full list of each nominee's favorable/unfavorable ratings can be found here, and was compiled from Pollster, TPM Poll tracker, Poll Report, and National Journal.
While all four of the most recent failed Vice Presidential candidates maintained overall positive favorability ratings from the time of their selection to this point in their post-VP run, Paul Ryan's rating remains the lowest, at just 41/40%. Consider the fact that both Joe Lieberman AND John Edwards (pre-love-child scandal, of course) maintained personal favorable ratings of +20 or more (44/15% and 46/26%, respectively). In short, Joe Lieberman was the most popular VP nominee of the last 4 elections, while Paul Ryan is the least (based on favorability ratings from the time of their selection to this point in their post-VP runs).
Monday, March 11, 2013
Key Takeaway for Republicans from Quinnipiac 2016 poll: Pray Hillary doesn't run
![]() |
| Demographic realities provide Hillary (and Democrats generally) with advantages in 2016. Photos courtesy of hillaryclintonoffice.com, & Reuters/AP. |
*numbers in parentheses indicates the results of a February 3rd, 2013 Public Policy Polling survey4. If the election for President were being held today, and the candidates were Hillary Clinton the Democrat and Christopher Christie the Republican, for whom would you vote?
Hillary Clinton - 45% (46)
Chris Christie - 37% (42)
Don't know/other - 19% (12)
5. If the election for President were being held today, and the candidates were Hillary Clinton the Democrat and Marco Rubio the Republican, for whom would you vote?
Hillary Clinton - 50% (49)
Marco Rubio - 34% (41)
Don't know/other - 16% (10)
6. If the election for President were being held today, and the candidates were Hillary Clinton the Democrat and Paul Ryan the Republican, for whom would you vote?
Hillary Clinton - 50% (50)
Paul Ryan - 38% (44)
Don't know/other - 12% (6)
Despite being 4 years out from the election, those are some rough numbers for the GOP, especially considering that Chris Christie and Paul Ryan are fairly well-known nationally, courtesy of Hurricane Sandy and a vice presidential nomination. Of the 3 Republicans tested, it's Paul Ryan who actually scores the highest level of national support (at 38%). The only problem with that is the fact that he elicits stronger support for Hillary Clinton, who comes in at 50%. So Ryan would essentially need to win all 12% of the voters who are undecided at this stage just to match Hillary. While Chris Christie attracts slightly less nationwide support than Paul Ryan (37%), he is able to hold Hillary well under 50%. Perhaps even more interesting, nearly 1 in 5 voters say they would be undecided on a Clinton v. Christie 2016 race. Marco Rubio, unsurprisingly, performs the worst against Clinton, only garnering 34% to her 50%. He is not as well known as Christie or Ryan, and his limited foray into the national spotlight will largely be remembered for this (as trite as it may be).
Unfortunately, it only looks worse for the GOP trio after peering at the Quinnipiac crosstabs. With all the talk of the GOP's demographic troubles, I decided to check out the ethnicity breakdown of the poll sample. 73% of respondents identified as white, 11% as black, 9% as Hispanic, and 7% as Asian/other. Compared to the 2012 election, Quinnipiac is finding registered voters to be more white and less minority. The only problem with that is the fact that white voters have declined as a percentage of the electorate in every election since 1992:
Not only that, but Latino's (a group Obama won in 2012 by a 71-27% margin) have gained in numbers every year since 1992. The African American portion of the electorate was largely static from 1980-2008, when it jumped based on enthusiasm for the first black presidential nominee. The purpose behind all this information is to illustrate that despite Quinnipiac poll findings, the electorate is very unlikely to see an increase in the white vote from 2012, and equally unlikely to see a decrease in the Hispanic vote. In fact, some have even suggested white turnout could drop to under 70% in 2016. Just for fun, what would the Quinnipiac results have looked like with white voters making up less than 70% of the electorate? The below chart illustrates what happens using a racial make-up of 69% white, 12% black, 12% Latino, 7% Asian/other.**
Tuesday, January 15, 2013
Hillary's favorability takes a hit, and Chris Christie's her most formidable 2016 opponent (PPP)
In a survey taken January 3-6, 2013, Clinton clocks in with an impressive natonal favorable/unfavorable rating of 54/39% (+15 pts), but that's down from PPP's previous survey in December that measured her at 57/36% (+21 pts), and significantly down from the 65+% ratings she enjoyed throughout much of 2012. In fact, her January PPP rating is the lowest measured by any polling firm since last April. Below is a chart of Hillary Clinton's national favorability rating since 2011, according to Talking Points memo, The Argo Journal, and assorted polling:
Monday, December 17, 2012
Paul Ryan vs. Hillary Clinton 2016? Not Even Close, says Purple Strategies Poll
Clinton: 53%
Ryan: 36%
Unsure/Other: 11%
Clinton stomps Ryan by 17 points. Not only that, but she dominates him in nearly every metric. She carries women by 24 pts (57-33%) and men by 9 points, 49-40%. Obama lost "men" to Romney 52-45%. Both Hillary and Ryan are strong with their base. The problem for Ryan, however, is that he's losing big among Independents (53-36%), and his base is outnumbered by Hillary's base by 10 points in this poll. In other words, the Purple Strategies likely voter sample identified as 40% Democrat, 30% Republican, and 29% Independent, or D+10. During the election just 6 weeks ago, voters identified as just 6% more Democratic than Republican. The last Presidential election in which Democrats and Republicans were at near-parity was in 2004, when both parties made up 37% of the electorate.
Subscribe to:
Posts (Atom)