Friday, May 31, 2013

It's Public Policy Polling vs. The World With Regards to Gov. Bob McDonnell's Approval Ratings

Public Policy Polling stands out among polling firms for their partisan, often times combative nature.


In the Virginia Governor poll released by PPP yesterday, and referenced by this blog, there was an easily missed statistic regarding the job approval rating for Virginia's Governor. According to the Democratic leaning pollster, Bob McDonnell (R) is above water with Virginia voters, but only somewhat:
Do you approve or disapprove of Gov. Bob McDonnell's job performance? (May 24-26, 2014; 672 Virginia voters, 3.8% MoE)

Approve  -  44%
Disapprove  -  37%
Not Sure  -  19%

This finding represents a net 6 point deterioration in approval for McDonnell's job performance since PPP's last poll in January (48/35%), and represents their lowest net rating for the Governor since July of 2012. But more significantly, the above finding represents a fairly significant departure from every other pollster to test the Virginia Governor's job approval this year, or even since taking office in 2010.

Just consider Quinnipiac University, which released a survey on Bob McDonnell's job approval rating less than two weeks before PPP. They found McDonnell's overall net job approval rating to be 3 TIMES higher than PPP (49/28% vs. 44/37%), while his rating among whites was DOUBLE PPP's finding (50/29% vs. 48/36%). Meanwhile, there's an astounding 30 point spread between Independents' views on Gov. McDonnell's job performance (54/27% per Quinnipiac, and 39/41% per PPP).

But there's no need to stop at Quinnipiac. Just 3 weeks ago, the Washington Post released a survey showing McDonnell with a net job approval rating 5 TIMES higher than PPP just found. And the same week, NBC/Marist found the same thing, as the chart below of McDonnell's job approval rating since the start of this year notes:


McDonnell's lowest rating this year besides PPP's most recent survey came in January, when he hit 48/35%, from none other than....PPP. Every other polling firm this year has found McDonnell between +21 and +37 in terms of net job approval/disapproval.

And the outlier-nature of PPP's Virginia Governor job ratings doesn't end with just this year:

Thursday, May 30, 2013

2009 VA Gov Electorate Voted 51-43% for McCain; PPP finds 2013 Electorate Giving 45% to Romney

John McCain, seen here with Va. Gov. Bob McDonnell in Oct. '09, wound up being a valuable asset to the campaign. Of the Virginians that voted on election day '09, 51% said they supported him in '08. Photo courtesy of Preston Gannaway & The Virginian-Pilot
Yesterday, Public Policy Polling released their second Virginia Governor poll of the year, with very little changed from the last survey in January. Terry McAuliffe (D) maintains his 5 point lead over Ken Cuccinelli (42-37%), while McAuliffe's net favorability rating fell slightly, and Cuccinelli's rose slightly. Oh, and in a rare move, the number of undecided voters actually increased from 13% to 21% since the last survey 5 months ago.

At the same time, PPP finds the Virginia electorate remains largely unchanged as well. Five months ago, Democrats held a 3 point partisan identification advantage (35% Dem, 32% Rep, 32% Ind), which is now down to one point (34% Dem, 33% Rep, 33% Ind). The racial identification findings from January and now are virtually identical (74% white, 18% black, 8% other), as well as ideological I.D., age I.D., gender, and '2012 vote'.

But how does the PPP electorate compare to the one found by exit polls in 2009, when Republican Bob McDonnell defeated Democrat Creigh Deeds in a landslide?

In most ways, it's similar, with one big exception.

White voters comprised a slightly larger slice of the electorate in '09 (78%) than what PPP finds now (74%), but not enough to significantly alter the poll results. The 2009 race featured an R+4 party I.D., while PPP finds D+1 (again, the difference is not enough to substantially change the survey result if reweighted). PPP also finds a larger gender turnout gap than seen in 2009, as well as a slightly older electorate, but nothing that would change the fundamentals of their topline.

The one exception to the above paragraph can be seen in the crosstab regarding the 2012 vote. Often times, pollsters will ask respondents who they voted for in the previous presidential election, mostly to get an idea of how the pool of survey takers compares to the prior presidential electorate (this question was frequently used in survey analysis in the run-up to the South Carolina 1st Congressional District special election between Mark Sanford and Elizabeth Colbert-Busch to gain insight into the strength of GOP turnout).

As has been noted here before, off-year, non-presidential races have a tendency (though not always) to attract less Democratic friendly electorates than in presidential years (see the 2010 vs. 2008 general election exit polls). But that is not the case in either of PPP's Virginia Governor polls. In both surveys, 49% of respondents say they voted for Barack Obama in 2012, while 45% claim they supported Mitt Romney. 6% say they supported someone else, or do not remember. That's an identical margin to the actual result in Virginia last November, when Obama carried the state 51-47%.

Wednesday, May 29, 2013

What Joe Miller's Return Means for the GOP: Alaska Senate could be the Christie v. Buono of 2014

Joe Miller and Lisa Murkowski debate just prior to the 2010 midterms. According to polling, Miller would lose to incumbent Mark Begich in a landslide in 2014. Photo by Al Grillo, courtesy of Corbis.

Caught up in a media world that that not only longs for, but demands competitive, theatrical political races, it's easy to gloss-over those contests lacking in the "drama" department. And what makes a better political contest than a close one? One where candidates are evenly matched, funded to the tee, and stir the emotions of their supporters and detractors?

But alas, the soap-opera contest cannot always be. Landslides are occasionally inevitable (usually involving a particularly strong incumbent or an unusually weak or unpopular challenger).

Sometimes, however, they're entirely avoidable. And yesterday, the 2014 Alaska Senate race took one big step closer to becoming one of those avoidable landslides for the GOP.

Yes, the Alaska Senate race features a one-term, relatively unknown Senator defending his seat for the first time in a state with a decidedly Republican slant. It's certainly not a state where you'd expect a freshman Democrat, elected by one point in a wave-Presidential year, to be in a position to win a midterm reelection overwhelmingly.

But fortunately for Senator Mark Begich (D-AK), the only Republican challenger making clear signals about running is a man who is despised by his state's general electorate, and underwater with members of his own party... Joe Miller.

So what happened to the man who came painstakingly close to becoming Senator just two and a half years ago? What caused the guy who defeated incumbent Lisa Murkowski in a Republican primary to become so disliked within his own party?

A series of ethical and ideological controversies that emerged near the tail-end of his almost-successful 2010 Senate campaign seem to be the catalyst, and his narrow Senate loss and subsequent law-suit to challenge the results did little to stop the bleeding.

Though whatever the cause of the once-rising Conservative stars' fall, the consequences seem pretty clear. Alaskans say they would vote overwhelmingly to reelect Democrat Mark Begich if their second option is Republican Joe Miller.

Not only that, but Alaska REPUBLICANS would just assume have anybody else - any potential Republican candidate - as their nominee in 2014.

The chart below documents every potential Alaska 2014 Senate Republican primary match-up involving Joe Miller from every pollster to test the race thus far (and the pickings are pretty slim; they're limited to just Public Policy Polling and Harper Polling - both partisan firms). But the results are remarkably similar:


In nearly every possible Alaska GOP primary match-up one could imagine, no matter the ideology or number of candidates running against him, Miller winds up as the LAST choice of Alaska conservatives. Meanwhile Gov. Sean Parnell is the most formidable 2014 Alaska Republican in the primary, with Sarah Palin being the second most formidable.

Tuesday, May 28, 2013

MA SENATE SPECIAL: Gabriel Gomez Is Doing Something Scott Brown Never Did in 2010 - He's Losing Momentum

Massachusetts has seen a fairly rapid turnover rate in the U.S. Senate after Sen. Ted Kennedy's death in 2009. Before then, the liberal lion served with Junior Senator John Kerry since 1985. Since then, Kerry served briefly as Senior Senator along with Scott Brown (R) from 2010-2013, when Kerry was nominated as Secretary of State, and Brown lost reelection. Now, polling indicates Elizabeth Warren and Ed Markey will become the new faces of the MA U.S. Senate delegation.

The Gabriel Gomez campaign for Massachusetts Senate was doused with cold water last week when both Emerson College and Public Policy Polling put a damper on what had been a slew of good polling news. While Gomez is still in a respectable position for a Republican running in one of the most liberal states in the Union, the polls are moving in the wrong direction from where he stood immediately after capturing his party's nomination for U.S. Senate last month.

In the first four surveys released following his Republican primary victory on April 30, Republican candidate and ex-Navy SEAL Gabriel Gifford never trailed his Democratic challenger Edward Markey by more than 8 points, or by less than 3 points. That is, until a Suffolk University poll emerged about a week later showing the long-term Democratic Congressman with a fairly significant, and more typical lead over Gomez of 52-35%.

As written about here at the time, the Suffolk survey appeared to be an outlier. Until then, the average of post-primary polling had Markey (D) up 45-40% on Gomez (R), while Gomez's numbers with women, men, Republicans, Democrats, Independents, whites, and non-whites were all within a strong to manageable range. But over the last two weeks, the Suffolk survey has grown to look less outlier-ish and more prophetic.

Since then, Public Policy Polling has come out with their second post-primary Massachusetts Senate poll, and while the topline still looked 'okay' for Gomez, the trend lines looked bad. In just two weeks, Ed Markey (D) managed to nearly double his lead (from 44-40 to 48-41%).

One week later, Emerson College was out with their 2nd post-primary survey, showing a different overall result from PPP, but with very similar trend lines. They too found Markey doubling his lead in just 3 weeks, from 42-36% to 45-33%. Suddenly, Suffolk University appeared to have company.

So where did Gomez's support go? Where did he experience his largest drop offs? Emerson College and PPP agree in some places on the answer, while disagreeing in others.

For example, both pollsters found the Republican Senate candidate's support among MEN slipping:


Emerson College found a net 14 point shift of support AWAY from Gomez among men, while PPP found a net 4 point shift away. Meanwhile the female vote remained largely static in both pollster's findings.

In terms of the racial splits in voting, PPP and Emerson College diverge. Though both polls find Markey gaining in the overall topline result, his surge stems from an improved standing with non-white voters per PPP, and from white voters per Emerson College. In fact, PPP finds a massive shift in Markey's favor regarding the preference of non-white voters (Markey's level of support jumped from 47 to 55%, while Gomez's level of support collapsed from 34% to 15%). See the chart below:


Saturday, May 25, 2013

ABC / Washington Post House Ballot Poll Stands Out In More Ways Than One

Photo courtesy of http://historicalromneys.tumblr.com/

You know a poll finding might be a little screwy when the actual pollster releases the information with an explanation or caveat. And that's exactly what happened on Thursday morning when Gregory Holyk and Gary Langer of Langer research wrote this in explaining the substantial Democratic lead on the 2014 generic House ballot question in ABC/Washington Post's new national survey:

While it’s far too early to handicap the 2014 election in any serious way, registered voters currently favor the Democratic candidate over the Republican in their congressional district by 48-40 percent, the largest Democratic midterm advantage since 2006. The party saw steep losses in the 2010 midterms.

The result almost entirely reflects a current Democratic advantage in partisan affiliation. Among registered voters in this survey, 33 percent identify themselves as Democrats, 22 percent as Republicans; most of the rest are independents, and they split evenly in their 2014 preference. Democrats outnumbered Republicans by 6 points in the 2012 presidential election and by 7 points in 2008, but they were even in the last two midterms – meaning the Democratic advantage holds only if their midterm turnout improves dramatically.
What Mr. Langer is saying here is not that their finding is incorrect (though that is certainly possible), but rather that if it is accurate, it would break precedent. And as I've pointed out on this blog before, he's right. A Democratic partisan identification advantage over Republicans of 11 points is just very, very unlikely in a midterm election. In fact, partisan identification in every midterm election since 1990 has ranged between D+3 and R+1, a fairly tight window of difference.

Moreover, a glance at the 2014 House Ballot polling over the last month shows ABC/WaPo is a bit of an outlier, both in terms of party I.D., and the overall topline result:

Because Rasmussen Reports tracks the generic House ballot question once a week, their findings are listed as a monthly average for the sake of the chart.

As you can see, the average of pollsters shows the Democrats with just a 3 point advantage over Republicans on the generic House ballot, not 8 points, and with a 7 point party I.D. advantage, not 11 points. So not only is the Washington Post poll an outlier in the scheme of historical 2nd-term midterm election results, it's an outlier when compared to recent House ballot polling.

Thursday, May 23, 2013

Despite rising job approval, Kay Hagan puts up her worst numbers yet against unsettled NC GOP field in new PPP poll

While some things have changed since 1998, a lot about the North Carolina electorate hasn't, according to Public Policy Polling crosstabs. That year, fmr. Sen. Lauch Faircloth (R-NC) (left) lost after one term in the U.S. Senate to newcomer John Edwards (D-NC). Photos courtesy of Ray Lustig / The Washington Post and Brooks Kraft/Corbis Sygma.
 
For all the chatter about the Republican's current inability to recruit a quality candidate to challenge North Carolina's junior Senator in the 2014 election, a new Public Policy Polling survey offers the state GOP with a glimmer of hope. Out of the Democratic pollster's six polls on the race since December 2012, a Republican named Cherie Berry has finally managed to TIE Sen. Kay Hagan (D), despite Hagan reaching her highest job approval rating yet (46/40%).

The chart below documents the results of PPP's 2014 NC Senate poll since December 2012, including only the candidates surveyed in the most recent poll:

Unfortunately for pollsters and researchers, exit polling in non-presidential year North Carolina Senate races is hard to come by (in 2010, there was no exit polling because Richard Burr led Elaine Marshall consistently throughout the campaign; in 2006, there was no NC Senate race; in 2002, major malfunctions with VNS led to exit polls being off, and as a result, incredibly difficult to come by. 1998 was the last NC Midterm with readily available exit poll data). This fact is important because without such data, it can be difficult for pollsters to weight the expected electorate.

Nevertheless, a frequently stated rule of thumb regarding midterms is that they typically feature a more white, less ethnically diverse, older, and generally more Republican type of voter than seen in Presidential election years.

So how do PPP's most recent findings regarding the potential 2014 electorate stack up as compared to the 2012 NC presidential electorate, and the 1998 Midterm electorate?

At least in terms of racial identification, the PPP crosstabs reveal an electorate that looks very similar to the one seen in 1998, when Democratic pariah John Edwards, then just beginning his political career and still well-liked, defeated 1-term incumbent Republican Senator and pig-farmer Lauch Faircloth, 51-47%. That year, 76% of the electorate identified as white, 22% identified as black, and 2% Hispanic/other. Flash forward 16 years to PPP's May survey, and the electorate is 76% white, 18% black, and 6% Hispanic/other.

In terms of partisan identification, age, and gender, the crosstabs diverge from the '98 Edwards/Faircloth race, at times resembling the 2012 electorate, and at times resembling nothing North Carolina electoral politics has experienced yet.

The chart below displays the North Carolina electorate in every election featuring a readily available exit poll since 1992, broken down by gender identification, age identification, and partisan identification:

Wednesday, May 22, 2013

Tea Party Revival? Two New Polls Provide Conflicting Results in the Wake of the IRS Scandal

The Tea Party was the runner-up 'Person of the Year' for Time Magazine in 2010. Tea Party members, politicians, and activists are pictured above, from left: Sharron Angle, William Temple, Scott Brown, Sal Russo, Rick Santelli, Glenn Beck, Rand Paul, Jim Demint, Sarah Palin (center), Ron Paul, Dick Armey, Stephen Broden, Michele Bachmann, Christine O'Donnell, & Amy Kremer (far right). Illustration courtesy of Finlay Mackay

Though never known for their immense popularity with the public as a whole, the Tea Party has experienced a ratings-dive since their hey-day before the 2010 midterm election. Fortunately for them, there is some new poll data that indicates the recent IRS scandal may be providing the movement with a sympathy bump in terms of public perception.

In 2010, pollsters found the anti-tax, anti-spending conservative group with an overall 33/34% favorable/unfavorable rating, while roughly the same portion of Americans either had no opinion, or refused to state their opinion. At the same time, 29% said they supported the movement, while 26% opposed it.

Yet since those days when the stock market rose and fell in wild swings in a single day, when the unemployment rate peaked at a 10%, when wages plunged to a 20-year year low, public sentiment soured on the always alluring, yet always divisive grassroots movement.

Following the Republican's 2010 midterm landslide, the Tea Party saw their evenly-divided favorability ratings drop to a decidedly negative 30/43% average. And though polling has been somewhat limited since the 2012 election, they've averaged an even less stellar 32/48% in the 6 months since November. Meanwhile, the margin of those saying they "support" rather than "oppose" the movement dropped 6 points since 2010.

But in two surveys out after news broke on May 10th that the IRS targeted conservative groups, it appears the Tea Party is receiving a bit of a sympathy boost as a result of the perceived slight.

CNN is the first to release poll findings showing the Tea Party with a notable gain in public perception. While a plurality of Americans still say they view the Tea Party unfavorably (45%), that number is down from 48% in CNN's poll two months earlier. The number of Americans viewing the Tea Party favorably has seen an even bigger jump, with 37% now viewing the group favorably, vs. 28% in March. Most of that improvement is seen among Democrats and Independents, not Republicans, oddly enough.

ABC/Washington Post joined the fray yesterday with another survey showing the often demonized Tea Party with a respectable 40/43 favorability rating.

But does polling truly indicate an emerging Tea Party resurgence? 

It depends on which of the two post-IRS scandal pollsters you believe most: CNN or ABC/Washington Post.

If you believe CNN, there is some definite movement in favor of the Tea Party as compared to two months ago. The chart below looks at every CNN survey on the Tea Party's favorability rating since 2011, immediately following their takeover of the House of Representatives:


The Tea Party's favorable/unfavorable rating has improved a net 12 points since March 2013, the best numbers measured by CNN since 2010.

Friday, May 17, 2013

McAuliffe pulls away from Cuccinelli as Quinnipiac finds a 2012 style gubernatorial electorate

Terry McAuliffe and Creigh Deeds during a 2009 Democratic Primary debate for Governor. Photo courtesy of A.P.

Quinnipiac University is out with their fifth survey of the 2009 Virginia Governor's race, this time showing Democrat Terry McAuliffe with his highest survey margin yet over Republican Ken Cuccinelli.


If the election for Governor were being held today, and the candidates were Terry McAuliffe the Democrat and Ken Cuccinelli the Republican, for whom would you vote?

Terry McAuliffe (D)  --  43%
Ken Cuccinelli  (R)  --  38%
Unsure/Other  --  20%
The results may surprise some, considering the barrage of negative press McAuliffe has received since Quinnipiac's last poll in March. But either Virginia voters are tuning out stories about McAuliffe's preference for Washington fundraisers over the birth of his children, or they just don't care. Because the Democrat has seen a 5 point gain in his support since March, while the Cooch has dropped 2 points.

So what gave McAuliffe his largest lead of the Virginia Quinnipiac survey yet, especially in light of the perceived negative press?

An initial glance at the crosstabs do little to explain the mystery, as both McAuliffe and Cuccinelli are winning similar portions of their own base, and Independents. In fact, Cuccinelli is actually doing slightly better than McAuliffe with his base, the opposing party, and Independents.

But a look at the demographic and partisan make-up of Quinnipiac poll respondents sheds light on McAuliffe's rise. Simply, the current electorate is decidedly 2012-esque.

The chart below documents every Quinnipiac Virginia Governor survey taken this season, including the partisan identification of the respondents of each poll.


As you can see, the most recent survey found Democrats with a 10 point partisan identification advantage over Republicans. That advantage is strong enough to give McAuliffe a 5 point lead over his challenger, despite both candidates performing equally well among their own party's base and Independents.

Not only does this month's Quinnpiac poll feature the largest party I.D. advantage for Democrats to date, but if it holds through November, it would represent a net 14 point shift from the last Virginia Governor's race in 2009.

That year, Republican Governor Bob McDonnell defeated his Democratic opponent Creigh Deeds in a near 20-point landslide, and Republicans turned out in much larger numbers than Quinnipiac now finds. In fact, that year, it was the Republicans that held a 4 point partisan I.D. advantage over the Democrats (37% R, 33% D, 30% I).

What would the new Quinnipiac poll look like had their findings detected an electorate as Republican as 2009, all other findings remaining the same?


Not surprisingly, a 14 point shift in party I.D. (from D +10 to R +4), produces a net 10 point shift in Ken Cuccinelli's favor (from a 43-38% deficit, to a 45-40% lead).

Tuesday, May 14, 2013

Is Alaska ready for a Palin comeback? They're not ruling it out, according to Harper Polling

Incumbent Senator Mark Begich (D) (left) could be facing fmr. Governor Sarah Palin (R) in his first reelection battle next November. Photo on left courtesy of Loren Holmes, photo on right courtesy of A.P.

GOP survey group Harper Polling is out with a new 2014 Senate Republican Primary Poll of Alaska, sponsored by the Tea Party Leadership Fund. And there's some encouraging news for Sarah Palin fans -- home-state Republicans still regard the former Governor and Vice Presidential nominee fondly, enough-so that they'd be willing to put her back in elected office next year:

If the Republican Primary election for U.S. Senator were held today, who would you vote for? Joe Miller, Sarah Palin, or Mead Treadwell?

Sarah Palin  --  32%
Mead Treadwell  --  30%
Joe Miller  --  14%
Not Sure  --  24%

In a one-on-one race with the only candidate to have announced an exploratory committee for 2014 so far, Joe Miller, Palin would lead her former protege 52-19%, with 29% undecided.

Given the public opinion beating Palin took after resigning as Governor of Alaska in the Summer of 2009, followed by brutal media treatment in the aftermath of the Tuscon Arizona shooting of former Rep. Gabrielle Giffords (D), it may seem somewhat surprising to see Palin positioned to win her party's nomination for office again in her home-state. But among Alaska GOPers, her favorability rating is a strong 62/30%, she's viewed as the most likely to "fight for conservative values" by 20 points, and as the "strongest person to take on liberal Democrats in Washington" by 16 points.  But as the cross tabs will indicate, Harper Polling is finding a much more "conservative" GOP Senate primary electorate than the one PPP found in the immediate aftermath of 2010's contentious battle between Joe Miller and Lisa Murkowski.

On August 24, 2010, Senator Lisa Murkowski (R) was NARROWLY defeated by Palin-endorsed Joe Miller for the GOP nomination for Senate, 51-49% (though Murkowski refused to concede the race until 1 week later). The rest was history, as Murkowski went on to wage a successful write-in campaign that November, defeating Miller (R) and McAdams (D) by a small margin.

In the aftermath of that highly contentious Republican primary battle, PPP conducted something like an exit poll, though instead of polling Alaskan primary voters as they left the polling booths, they simply called them at their homes the following day.

In that survey/exit poll of the 2010 Miller v. Murkowski primary battle, 59% of respondents identified themselves as Conservatives, 37% as Moderate, and 4% as Liberal. Now certainly, political environments can change, question wording can yield different results, and pollsters can just be wrong. And based on the disparate ideological I.D. findings of the two polling firms, one has to believe that one of those three things happened.

While PPP found just 59% of the August 2010 Alaska GOP primary electorate to be conservative, 84% of Harper Polling respondents claimed to be conservative. While PPP measured 37% of the 2010 Alaska GOP primary electorate to be Moderate, Harper Polling found just 14% identifying as such. While PPP found 4% identifying as Liberal, Harper Polling found 1%.

And as it's the habit of this blog, let's see what the new Harper Polling survey would have shown had they found a GOP primary electorate more like the one PPP says showed up when Miller narrowly defeated Murkowski in 2010:


Lt. Governor Sean Treadwell and former GOP Senate nominee Joe Miller both see their numbers improve under a 2010 turnout-scenario, while Sarah Palin's decline.

Monday, May 13, 2013

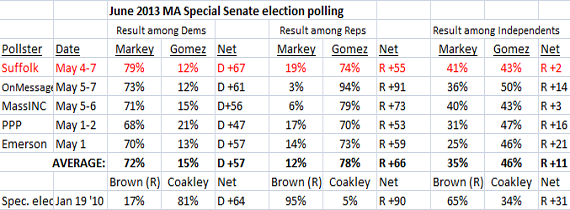
Suffolk University MA Senate Special Election poll appears to be an outlier

A Thursday, March 7, 2013 Boston Herald spotlight on the 2013 Massachusetts Senate Primary and Special Election

Suffolk University released their first MA Senate special election survey late last week, and found notably better news for the Democratic nominee than the first four post-primary surveys have shown. With the race just six weeks away, Ed Markey leads Gabriel Gomez (R) 52-35%, according to a survey taken May 4-7:

On June 25th the General election for U.S. Senate will be held. The three candidates listed on your ballot are Gabriel Gomez -- Republican, Ed Markey -- Democrat, and Richard Heos -- Twelve Visions Party. For whom would you vote or toward whom do lean at this time?

Gabriel Gomez  (R)  --  35%
Ed Markey  (D)  --  52%
Richard Heos (TVP)  --  1%
Undecided/Refused  --  12%

If Suffolk is right, then Gomez must be struggling to perform as strongly with crucial groups as Scott Brown in his successful January 2010 special Senate election. The cross tabs certainly bare that out as well.

While Suffolk finds the racial make-up of the 2013 special election to be very similar to that of the 2010 contest, Gomez is currently performing much weaker with white voters than Scott Brown. The latter won this group 55-44% in 2010, while the former only manages 35% in the Suffolk poll (to Markey's 53%). Considering that white's make up 85% of Suffolk respondents, an 18 point deficit with whites would demolish any Republicans chances, very quickly.

Fortuntaely for the Gomez campaign, however, is the fact that Suffolk is the only post-primary MA special election pollster so far to show Gomez trailing so much among white voters. Consider the chart below:


The three pollsters to sample this race following the primaries found Markey leading Gomez among whites by no more than 3 points.  If you average the four pollsters, Markey leads Gomez among whites 46-39% , and 54-25% with non-whites. As noted in the final row of the chart above, this won't quite cut it for a Republican upset in June.

In terms of partisan identification in the Suffolk poll, while Gomez looks strong with his own party, he's not doing nearly well enough among Democrats and Independents (the only winning formula for a Bay State Republican). He only picks up 12% of Democratic voters, while barely carrying Independents 43-41%. At the same time, 19% of Republicans say they'll back Gomez's Democratic opponent.

Compare those numbers to Scott Brown in 2010, and you'll see why Gomez is in trouble. Brown manged to win 17% of Democrats, while only losing 5% of Republicans to Coakley (D). But that's not what won it for him. It was his very impressive winning margin among Independents that gave him his Senate seat., carrying them by a whopping 31 points (65-34%). Since the primary, Gomez has averaged a 46-35% lead among Independents.

So while PPP, OnMessage, and Emerson College have shown Markey with impressive leads among independents, they're not large enough for him to win the race. Meanwhile, MassINC and Suffolk see no Independent advantage for Gomez:


Thursday, May 9, 2013

Gov. Nikki Haley looks strong in SC-1, But Not As Strong As In November 2010

Gov. Haley (R - SC), 2nd from left, pictured with staff for Vogue photo-shoot in 2012. Photo courtesy of Norman Jean Roy & Vogue.

In all the hysteria surrounding the circus that was the South Carolina First Congressional Special Election, a little-noticed poll finding from PPP's now infamous "Colbert-Busch surging" April survey surely got the attention of both Gov. Nikki Haley and her likely 2014 opponent State Senator Vincent Sheheen (D).

In the same poll where PPP found Elizabeth Colbert-Busch with a 9 point lead over Mark Sanford, Gov. Nikki Haley led  Sheheen by a margin of 44-38%; much smaller than the margin by which Mitt Romney carried the first district in 2012 (58-40%), and indeed, smaller than the margin Mark Sanford eventually won the district (54-45%).

Not only that, her 44-38% lead over Sheheen in a heavily Republican district represents quite the deterioration in her support since election night 2010.

Unfortunately for researchers, determining Haley's support in the 2010 Governor's race by congressional district is NOT easy. For starters, the boundaries of District 1 were entirely different when Haley was first elected in November 2010. And to make things MORE difficult, South Carolina does not provide gubernatorial results by congressional district (because SC districts rarely follow actual county borders). But thanks to Harry Enten of The Guardian and the South Carolina Election Commission, I was able to track down the Haley v. Sheheen results in every precinct that makes up the CURRENT District 1. Through that research, it was determined that Nikki Haley defeated Vincent Sheheen for Governor in CURRENT-DAY SC-1 by a margin of  58-40% (the same margin by which Romney carried the district against Obama). See the table below for South Carolina Governor Results in EACH county that is at least partially contained within the 1st district: (for a complete tabulation of the 2010 Governor votes in each 1st congressional district precinct, go here.)


Now you can see why 44-38% in a district she carried by 18 points bodes very poorly for Haley, especially considering that her overall winning margin in 2010 was just four points, or 51-47%.

But not so fast. Wasn't that April PPP poll widely canned in the aftermath of the SC-1 election? Remember, that poll that showed a wild fluctuation to a very Democratic friendly electorate for one survey, before returning back to it's nearly identical electorate from before in the final poll?

If you agree with The New Republic's Nate Cohn and The Guardian's Harry J. Enten's take on tha April "Colbert-Busch surging" poll from PPP, then Nikki Haley can take solace in the fact that she's likely doing a bit better in SC-1 than a 44-38% lead over her Democratic challenger.

To see exactly how well she COULD BE DOING, let's simply reweight the April PPP racial I.D. numbers and ideological I.D. numbers to the two survey findings that fell more in line with the 2012 SC-1 presidential electorate (their 1st and final SC-1 poll).

The chart below takes a look at how Nikki Haley's numbers would have looked against Vincent Sheheen in the 1st District had the racial identification of the respondents looked like PPP's March and May surveys:


As you can see, Governor Haley would've had as much as a 9 point lead over Sheheen (44-35%) had PPP found an SC-1 electorate like they had in March.

Wednesday, May 8, 2013

The Roller Coaster Electorate - A Guide to PPP's South Carolina Special Election Polling

Photo courtesy of rawstory.com
Last night, reputable polling firm Public Policy Polling (D) had one of their worst misses in months, while newcomer Red Racing Horses did little to advance their stature.

They were the only two polling firms to release public surveys on the South Carolina 1st Congressional District special election between Mark Sanford (R) and Elizabeth Colbert-Busch (D). And neither was able to see that the infamous "Appalachain Trail" Governor was about to make a triumphant landslide return to Congress.

To be fair, it wasn't an easy outcome to predict given Sanford's luck over the last three weeks.  He was abandoned by the national Republican Party, he was competing against a pseudo-celebrity challenger, he was being outspent 5-1, and embarrassing details about his divorce to Jenny Sanford were hitting the press.

Nonetheless, The Guardian's Harry J. Enten has a great post-mortem on the pollster failings in this race, specifically PPP's 2-week old finding of Colbert-Busch leading Sanford by 9 points, which as Enten notes, has the dubious distinction of being one of the worst polls taken in any special election since 2004.

Enten's piece, as well as a twitter debate between The New Republic's Nate Cohn and a Daily Kos tweeter, prompted me to take a closer look at the shifting electorate reported by PPP over the three polls and six weeks they surveyed this special election. 

As the chart below indicates, as brief as it was, the SC-1 special election was somewhat of a roller-coaster ride according to PPP, in terms of both who led the race and who PPP expected to comprise the electorate:


The race started in late-March with the Democrat at a very, very small advantage, which was unusual considering the partisan leanings of the 1st District, as well as the fact that PPP poll respondents looked awfully similar to the 2012 presidential electorate; they supported Romney over Obama by 56-40% (similar to the actual 58-40% margin), conservatives greatly outnumbered moderates and liberals by a 2-1 margin, Republicans outnumbered Democrats by 15%, and African Americans only made up 12% of the electorate.

Monday, May 6, 2013

Massachusetts Senate: Gabriel Gomez (R) exhibiting similar demographic strengths to Scott Brown 2010

Massachusetts Republican Senate nominee Gabriel Gomez campaigns in Shrewsbury, MA in February, prior to his 15 point primary win last Tuesday. Photo courtesy of AP/Winslow Townson
Last week long-time Democratic Congressman Ed Markey successfully defeated his pro-life, Obamacare opposing primary challenger Stephen Lynch 57-43%, while on the Republican side, newcomer ex-Navy SEAL Gabriel Gomez defeated opponents Mike Sullivan and Dan Winslow 51-36-13%.

Fortuanately for Republicans, early polling on the race had indicated that of all the possible match-ups for the special election, a Gomez vs. Markey battle would be the most competitive. Gomez (R) performed better than Sullivan or Winslow in all pre-primary polling against Markey OR Lynch, while Lynch performed stronger against all 3 potential GOP opponents than Markey. So in terms of all the different potential match-ups, the Republicans lucked out, as a new Public Policy Polling (D) survey confirms:

The candidate for US Senate are Republican Gabriel Gomez and Democrat Ed Markey. If the election was today, who would you vote for?

Ed Markey  (D)  -  44%
Gabriel Gomez  (R)  -  40%
Undecided  -  16%

Prior to his primary win, Gomez had trailed Markey by 15 and 19 points. Since his win, two polls have shown the race within at least 6 points, WNEU and now, PPP.

In the special election three years ago, loser Martha Coakley (D) never relinquished her lead over eventual winner Scott Brown (R) until about 2 weeks before the actual election. This year's election is still 6 weeks away. So obviously, things look pretty good at the moment for Gabriel Gomez. He's starting ahead of where Scott Brown was in polling at this point in 2010, and has ample time to move ahead of Markey (or perhaps, move further behind).

The two most recent, non-presidential-electorates in Massachusetts took place in 2010. Scott Brown defeated Martha Coakley (D) 52-47% that January, while Gov. Deval Patrick (D) won reelection against Charlie Baker (R) and Tim Cahill (Independent) 48-42-8%.

How does the 2013 special election electorate compare to the one that catapulted Brown to victory in January 2010, and the one that helped Patrick survive for a 2nd term that November? They're similar in some, but not all ways.

For example, consider the racial identification PPP gound in the 2013 Senate poll:

Information compiled from 2010 Brown v. Coakley exit polling, 2010 Patrick v. Baker v. Cahill exit polling, and 2006 exit polling.

Wednesday, May 1, 2013

Fun With Nate Silver's New Interactive Map: Democrats' many paths to 270 in 2016

President George W. Bush held Democrat John Kerry to just 53% of the Latino vote in 2004. But even if Republicans replicate Bush's performance in 2016, they'd have to maintain their 2012 margins with white voters to win.

In the 2012 election, Democrats captured a historical 72% of the Hispanic vote, leading many pundits to speculate that Republicans could have a difficult time capturing the White House in 2016...or perhaps, ever again.

In light of the emerging debate surrounding the effect of immigration reform on Presidential election results, FiveThirtyEight's Nate Silver released an awesome interactive map yesterday that allows users to tamper with various demographic and voting distrubition scenarios to produce certain election results WELL into the future (2048, to be exact). And based on what I've seen from the map, it's pretty difficult to create a plausible scenario where the GOP would win in 2016, much less 2048.

Off the bat, I'll note what Nate Silver pointed out in his article yesterday: "Population growth and changes in voting patterns will have much larger effects than how unauthorized immigrants are treated."

In other words, playing around with the percentage of immigrants that could hypothetically become citizens as a result of immigration reform, as well as the percentage of immigrants that could wind up actually voting, effects the results VERY, very little. I'm talking fractions of a point (which kind of blows a hole in Politico's heavily debunked analysis from last week that immigration reform could create an electoral bonanza for Democrats.)

As a result, I let most of Nate Silver's assumptions remain (which were all derived from a 2012 election baseline), tampering only with white, black, and Hispanic demographic vote distribution.

SCENARIO #1:
The first scenario below shows the GOP winning the 2016 presidential election by a narrow 286-252 electoral college votes, and an even narrower 49.6 - 48.6% popular vote win. But getting to this result requires some pretty optimistic assumptions for the GOP. The Democrats share of the white vote would have to drop from 39% to 37%, their share of the black vote would have to drop from 95% to 90%, and their share of the hispanic vote would have to drop from 72% to 67%:


Regarding the black vote: Democrats attracted between 83-90% support from African Americans in presidential elections from 1984-2004. But the election of one of their own in 2008 boosted those numbers to their now near-unanimous 95%. With another non-African-American Democrat running for President, it's possible to see the African American vote returning to pre-2008 levels of 90% or less for Democrats in 2016.