Tuesday, April 30, 2013

Hurricane Sandy's Other Legacy: Did Late-Deciders Throw The 2012 Election To Obama?

President-elect George H.W. Bush greets the man he defeated by 8 points 1 month prior at his home in Dec. 1988. According to exit polls, Dukakis was just coming alive in the final days of the campaign. He defeated Bush among the 15% of voters that made up their mind in the final week by an impressive 55-43% margin. Photo courtesy of The Atlantic.

Yesterday morning,  Chris Christie took to MSNBC's 'Morning Joe'  to praise the President for his handling of storm aide since Hurricane Sandy made landfall in New Jersey on October 29th. In response to a question from host Joe Scarborough, Christie replied:

 "Listen, the President's kept every promise that he made. And the fact is that...that's what I was saying at the time. What I was saying at the time is I was asked about how was the President doing and I said 'he's doing a good job. He's kept his word.' And so, everybody knows that I have about 95% level of disagreement with Barack Obama on issues of principle and philosophy. But, the fact is, we have a job to do. And what people expect from people they elect is to do their job. And that's why they hate Washington so much..."

Nevermind the context of the comment. The bolded section is what received the blaring Drudge Report headline. And if anything gets remembered from this MSNBC segment during primary season 3 years from now, it won't be Christie's eloquent defense of his actions in the days following Hurricane Sandy. It will be the continued praise of a President loathed by Christie's base.

But putting aside how Republicans feel about whether or not Chris Christie actually cost Mitt Romney the Presidency in 2012, a much more basic question needs answering: did Hurricane Sandy flip the election to Barack Obama? Because if it didn't, Republicans can blame Christie for providing comfort to the enemy at most, but NOT for costing them the presidency.

The simple answer to to the above question is no; Hurricane Sandy did NOT flip the election to President Obama, at least not if you believe the exit polling. And as a result, no, Chris Christie did not cost the GOP the election in 2012. Consider the chart below:

2004-present info compiled from CNN and Roper Center. 1976-2000 info compiled from Best & Krueger's Exit Polls. 1984 exit polls did not include a question regarding the timing of respondents vote decision.

Obama apparently won among voters that decided BEFORE the final few days of the campaign by a margin of 51-47%. But among the 9% of Americans who said they made up their mind in the final few days of the campaign, Obama's margin over Romney was even greater (50-44%).

Thursday, April 25, 2013

Midterm vs. Presidential Demographics: GOP can't count on 2010 turnout in 2014


Reid photo courtesy of A.P.

Throughout the 2012 Presidential election, the likely racial make-up of voters who would make an appearance at the polls on election night was a source of intense debate among pollsters and the media.

Republicans hypothesized the Obama camp would be unable to replicate the record-breaking minority turnout they generated four years earlier, when Obama became the first Democratic President since Jimmy Carter in 1976 to win a majority of the popular vote (and by a much larger margin than Jimmy). Democrats believed their GOTV operation was top-notch and superior to Team Romney's; besides, white voters as a percentage of the electorate had dropped in every presidential election since 1992, while minority voters have been on the rise.

In the end, Republicans were right on one thing, but dead-wrong on everything else. Obama indeed failed to match his 2008 near-landslide defeat of John McCain with Mitt Romney...but he won anyway, and Republicans lost the demographic-debate battle. Not only did minority voters match their turnout numbers from four years earlier, they exceeded it.

Even worse for the GOP, a near-impossible to deny trend in presidential demographics was further confirmed last November- namely, that whites have dropped as a percentage of the electorate in every presidential election since 1992, while non-white voters have increased.

Fortunately for Republicans, the next election will not be a presidential one. 

But does the news really get better for the GOP just by virtue of the fact that the upcoming election is a midterm? What, if anything, do these presidential trends tell us about what we can expect one year and a half from now?

Well, if midterm demographics follow the same pattern presidential demographics followed in 2012, they tell us a good bit.

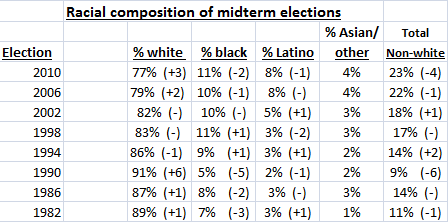
The chart below compiles racial turnout numbers for every midterm election since 1982:

Number in parentheses represents the % change from the preceding presidential election. Information courtesy of Best and Krueger's Exit Polls; Surveying the American Electorate, 1972-2010.

Several pieces of data from the chart stand out.

Monday, April 22, 2013

Despite Gosnell Trial, slew of new state restrictions, public opinion still mostly pro-choice on abortion

Dated January 22, 1973. Photo courtesy of veracitystew.com.

Over the last few weeks, Americans have heard a flurry of stories regarding abortion (or not). From the mass infanticide that occurred at the hands of Dr. Kermit Gosnell at a Pennsylvania abortion clinic, to tough new restrictions being enacted in four states, the always-controversial topic has returned to the center of public debate. And according to at least one source, a narrow majority now think abortion should be illegal with or without exceptions, even as 53% say they support gay marriage.

But contrary to NBC's recent finding, a close look at the entirety of abortion polling over the last two years indicates Americans are generally more supportive of abortion rights than not, with less than a quarter supporting a blanket ban. However, as often the case, abortion polling data is highly predicated on question wording/phrasing.

This article takes a look at the often complex nature of abortion polling from January 2011 to present, using surveys compiled from pollingreport.com, argjournal.blogspot.com, and other assorted internet searches. 
Now, back to question wording.

Opinions on abortion are all over the map, depending on how the pollster chooses to phrase the question and frame the debate. For example, opposition to the procedure tends to run a bit higher than average when pollsters specifically offer the rape/incest/life of mother exception as an answer option. In fact, the above referenced NBC/WSJ poll showing 52% opposing abortion with or without restrictions specifically asked: "Which comes closest to your view on abortion--abortion should always be legal, should be legal most of the time, should be made illegal except in cases of rape, incest and to save the mother's life, or abortion should be illegal without any exception?"

Over the last two years, 5 polls have been taken in which the abortion question contained some variation of the rape/incest/life of mother option, and by a 50-48% margin, respondents felt abortion should be illegal with or without exception. 48% of respondents said abortion should be legal in all or most circumstances:

* Marist asks: "Which of the following statements comes closest to your opinion on abortion: 1) abortion should be available to a woman any time she wants one during her entire pregnancy. 2) abortion should be allowed only during the first 6 months of a pregnancy, 3) abortion should be allowed only during the first 3 months of a pregnancy, 4) abortion should be allowed only in cases of rape, incest , or to save the life of the mother, 5) abortion should be allowed only to save the life of the mother, or 6) abortion should never be permitted under any circumstance."                                                                                                 ** CBS asks whether abortions should be 1)"permitted in all cases," (35%) 2) "permitted with greater restrictions," (13%) 3) "only in cases of rape/incest/save woman's life," (27%) 4) "only to save woman's life," (10%) OR 5) "not permitted at all." (11%)


There is only one other abortion question phrasing that yields a net negative number of people supporting legal abortion. When both CNN and Gallup pollsters asked respondents whether they felt abortion should be legal under any circumstance, most circumstances, a few circumstances, or illegal in all circumstances, an average 58% of respondents came down more on the pro-life side, while just 39% felt abortion should be available under any or most circumstances:

Wednesday, April 17, 2013

Chris Christie's Gubernatorial Opponent Slowly, But Surely Chipping Away, Luring Back Wayward Democrats


Christie at a campaign event in December 2012. Photo courtesy of N.J. Star-Ledger

Nearly 6 months after Hurricane Sandy ravaged the Jersey Shore and sent Governor Chris Christie's re-election prospects soaring, survey findings are in firm agreement: Christie is still the heavy, heavy favorite to win, but Democratic challenger Barbara Buono is very slowly, but surely chipping away at his lead w/ traditional Democratic voting blocks.

Since the rare Northeastern Hurricane made landfall late last October, the moderately popular Chris Christie not only saw his job and personal ratings skyrocket, but saw virtually every serious, potential challenger to his governorship step aside in the wake of his soaring popularity. That is, every challenger but one, longterm state legislator named Barbara Buono (D). And until last month, it looked as though Christie might hold onto a rock-solid 40-50 point lead against the unknown Buono.

Then came a Fairleigh Dickinson poll showing a modest, though definite decline in support for Christie on the general ballot question. Since then, 2 more pollsters, Quinnipiac and Rutgers Eagleton, have confirmed that Buono is gaining, slowly, slightly, and surely; especially when you look at her support among Democrats and blacks, two voting blocks she has to nail down in order to give Christie a serious run for his money
The table below documents every poll released on the Christie v. Buono race, and was compiled from argojournal.blogspot.com, TPM Poll Tracker, and Huffington Post Pollster. Results among all general election voters, Democrats, and African Americans are provided:

*Fairleigh Dickinson's demographic cross-tabs provide a breakdown for white and non-white voters, not white and black voters. Red/"CC" indicate a Chris Christie lead, Blue/"BB" indicate a Barbara Buono lead.

Breaking down the poll results in the above chart by pollster, Rutgers Eagleton shows a discernible drop in support for Christie since their last poll (62% to 57%), as well as an appreciable rise in support for Barbara Buono (20% to 27%). In their January poll, Quinnipiac had Christie leading Buono by an impressive 41 points, or 63-22%. Two polls and two months later, Christie had fallen to a 35 point lead, 60-25%. And as mentioned above, Fairleigh Dickinson has seen Christie's lead dissipate from 43 to 36 points.

Tuesday, April 16, 2013

Coattail Effect: How far can a Governor's job approval carry his or her party's presidential nominee?

Governor Bob McDonnell (R) (left) has an enviable 51/29% job approval rating back home in Virginia, yet the Republican candidate for President lost to the President by 3 points. Meanwhile, Wisconsin GOP Governor Scott Walker (right) had a decent 51/46% job rating, yet Romney lost his state by 7 points.
Virginia Governor Bob McDonnell became one of the most prolific campaign surrogates in the 2012 election, crisscrossing the country on Mitt Romney's behalf. Not only was he a popular home-state Governor, but he just happened to be the chief executive of one of the most hotly contested swing-states in the nation. That's a helpful combination to have around. While popular Republican governor's like Chris Christie and Susana Martinez were good faces to have associated with the Romney campaign, their home-states of New Jersey and New Mexico were never really in contention. They didn't pack the same one-two punch of Virginia's Bob McDonnell.

Obviously, there's a reason we seldom saw or heard of Florida Governor Rick Scott barnstorming across the state with Mitt Romney, or Pennsylvania Governor Tom Corbett holding local town-halls with Paul Ryan. Both of them averaged 39/45% and 35/46% job approval/disapproval ratings respectively in the final two months of the campaign.

But does the actual evidence suggest that a Governor's job approval/disapproval rating can affect Presidential election results on a state level? Unfortunately, the data is not terribly clear.
The table below contains a lot of information, so let's break it down piece by piece. It compares the job approval/disapproval ratings for every U.S. governor over the final two months of the 2012 Presidential campaign to actual election results, as well as actual election results to Obama/Romney's favorable/unfavorable ratings. In order for a particular state Governor to be included in the chart, he or she must have had at least one job approval assessment in the September and October before the election. That's why a few Governors, like Alabama, Mississppi, Wyoming, etc are missing. Red entries indicate either a Republican Governor, a Republican election win, or a net state-based positive favorability rating for Mitt Romney in the presidential election. Likewise, blue entries indicate Democratic Governors, a Democratic election win, or a net state-based positive favorability rating for Barack Obama. Since exit polling was only conducted in 31 states in 2012, not every state will include an Obama/Romney favorability assessment. Polling information was compiled from tpm poll tracker, pollster, and various internet searches:

For an easier to read, larger version of the above table, click here.

Of the top 10 most popular Governors in the country (based on polling averages taken from September 1-November 6 2012), 5 were Democrats, and 5 were Republicans, in 5 blue states, and 5 red states. Of the 10 least popular, 5 were Democrats, 4 Republicans, and 1 liberal Independent, in 9 blue states, and 1 red state. This stat seems to suggest red-state residents (those states that voted for Romney in the last election) tend to be bigger fans of their Governors (whether they be Democrats or Republicans) than blue state residents.

Saturday, April 13, 2013

Kentucky DEMs catch a break with Ashley Judd out, but is McConnell as vulnerable as it seems?

Minority Leader McConnell (left) and a strong potential Senate opponent, Sec. of State Alison Lundergan Grimes (right). The Grimes photo is from a 2011 campaign ad & is  courtesy of the Grimes campaign. The McConnell photo is courtesy of Alex Wong/Getty Images.
Democrats made clear early on that Senate Minority Leader Mitch McConnell would be on their very small list of top pick-up opportunities in the 2014 midterm elections.  Since then, much of the media focus in terms of McConnell's likely opponent centered on Hollywood actress Ashley Judd, a Democratic activist who grew up in the Bluegrass State with her famous country-duo Mom and Sister, Wynonna and Naomi Judd.

But Democrats caught a break two weeks ago when Judd announced, after a rough exploratory phase, she would not be challenging McConnell.

Though she started out somewhat competitive in polling (she trailed Junior Kentucky Senator Rand Paul 47-46% and McConnell 47-43% in a December PPP poll, and trailed 49-40% in a February Harper Polling survey), a brutal media barrage took its toll on Judd's image. First, there was the fact that though she would be seeking a Senate seat in Kentucky, she actually lives in Tennessee, and has for the last several years. Then came her bizarre affinity for comparing everything to rape - at first it was coal mining, then this bomb dropped: "I've been raped twice, so I think I can handle Mitch McConnell.Just a day after the story surrounding the latest rape comment surfaced, Judd announced she wouldn't challenge McConnell.

And if the latest Public Policy Polling survey is to be believed, it was a wise decision on Judd's part. Her favorability rating with Kentucky voters dropped 13 points in just 4 months, from +6 in December, to -7 (34/41%) in April. When matched in a hypothetical 2016 Senate race with Rand Paul, she now trails 51-40%.

While it's questionable whether Judd would have been successful in a Democratic Primary, the McConnell campaign almost certainly would rather have faced her than their new potential opponent, KY Secretary of State Alison Lundergan Grimes.

Grimes is a youthful (just 35 years old!), attractive, and most importantly, Kentucky native up-and-comer who was catapulted into her current (and first) elected position in a 2011 special election...yet she trails the Senate Minority Leader just 45-41%.

So where does her impressive performance against McConnell stem from in the internals? In terms of partisan identification, not so much from Independents. They're backing the 5-term incumbent by a slight plurality, 41-39%. And while she attracts 61% from her own party, she's not terribly appealing to Republicans, getting just 16% of their support.

Meanwhile, Mitch McConnell is actually quite strong among Kentucky Democrats, attracting 24% of their vote, the same amount he won in his last reelection bid (for comparison, Rand Paul won 16% of Democrats in his 2010 Senate race against Jack Conway). He's also considerably stronger among his base, picking up 74% of Republicans.

If McConnell is winning Republicans by more than his opponent is winning Democrats, and if he's attracting more crossover support from Democrats than Grimes from Republicans, and if he's leading slightly among Independents, how is this just a 4 point race? It most definitely has something to do with the fact that PPP finds 51% of respondents identifying as Democrats, but just 39% identifying as Republicans, a D+12 partisan advantage. Kentucky voters  may indeed be identifying as such today, but the chart below indicates it would be a Kentucky election first if D+12 holds until November 2014, especially for a non-presidential election year contest:

No Exit polling was conducted in Kentucky in 2012, 2011, and 2007.

As you can see, in every Kentucky election over the last 10 years in which exit polling was conducted, Democrats have outnumbered Republicans a maximum of 9% (and that was in the near-landslide Democratic presidential year of 2008). The Republican's strongest performance in partisan identification came just 2.5 years ago, during the Tea Party take-over of Congress.

Thursday, April 11, 2013

The Predictive Power of Presidential Job Approval on Election Outcomes, according to 1978-2012 Exit Polling

Presidential Job Approval based on exit polling, 1978-2012
It's been posited by some that a president's job approval rating is a pretty decent predictor of eventual election outcomes. But study's that have looked at this before tend to base their findings on pre-election political surveys on who says they will vote, rather than exit poll data that surveys actual voters.

A look at what exit polls have reported on past presidential job approval shows that while attitudes towards the President's job performance are occasionally on-the-mark with regards to the national popular vote, they're not always. For example, voters are frequently willing to vote AGAINST a President or his party's nominee whose job performance they APPROVE of.

More than that, exit poll findings regarding a president's job approval are far more predictive of actual results when an incumbent is seeking re-election, as opposed to the incumbent party's nominee seeking election.

Job performance also tends to be less prognosticative of actual results in midterm elections, as opposed to Presidential, while the President's APPROVAL rating is more likely to reflect his proportion of the vote than his DISAPPROVAL rating is to reflect his opponent's vote share.
The chart below documents the President's job approval rating in every presidential and midterm election since 1978. From 2004-2012, exit poll data from CNN is relied upon. From 1978-2002, exit poll data is provided by Samuel J. Best and Brian S. Krueger's Exit Polls, Surveying the American Electorate, 1972-2010, with the exception of 1988 data, which was retrieved here. Unfortunately, exit pollsters did not ask voters their opinion regarding presidential job approval in 1980, 1984, 1992, and 1996. Thus, in 4 of the 18 elections examined in the chart below, the President's job approval rating is based on the final Gallup Poll taken prior to that election, not exit poll data.

* indicates the President's job approval rating for this year is based on Gallup's final pre-election poll. All other findings come from exit poll results. Red indicates a Republican election victory, blue indicates a Democratic election victory. "H" means "House." "S" means "Senate." House and Senate votes tallies are provided by USHouse.gov

As the chart indicates, excluding midterm elections, voters have frequently voted against Presidents they approve of. A solid 54% majority approved of the job President Barack Obama was doing as they headed to the polls on Nov 6, 2012, but the President only won 51.0% of the vote.

Tuesday, April 9, 2013

Gaffe-prone Joe Biden Looks Good In Early 2016 Polls, But So Have Other Two-Term VPs

Joe Biden and his boss with the last 2 two-term Vice President's to run for the White House (and their boss).
Vice President Joe Biden, if he runs for President in 2016 and wins, would only be the fourth two-term VP to do so in history, with John Adams (the nation's 1st VP), Richard Nixon, and George H.W. Bush paving the way before him. Only eight VP's have even served two full terms in that office, though only four of them ever ran for President after the fact (John Adams, Richard Nixon, George H.W. Bush, and Al Gore).

Thus it would seem that launching a Presidential campaign after 8 years in the Vice President's office isn't as common, or as advantageous as you may think.

But that certainly isn't stopping Joe Biden from whipping up chatter among political pundits about his own presidential prospects. As early as October 2011, nearly a year and a half before the start of Obama's 2nd term in office, Biden was fanning the flames: "I'm in one of the -- probably the best shape I've been in my life. I'm doing pretty well. I'm enjoying what I'm doing. And as long as I do, I'm going to continue to do it."

And that was far from Biden's last flirtation with 2016. In fact, you could probably spend the better part of a day recounting all the times Biden has noted he's interested in 2016 since taking office as VP in January 2009.


Further buttressing the Vice President’s desire to run for the White House could be the slate of mostly favorable polling that’s come out this year. In 14 hypothetical 2016 match-ups against Republicans Marco Rubio, Chris Christie, Paul Ryan, Rand Paul, and Jeb Bush, Biden only trails in three of them (to New Jersey Governor Chris Christie), and leads by as much as 14 points (against Marco Rubio in a March Marist survey). On average, he leads his GOP opponents by a 46-43% margin and receives a similarly positive overall favorability rating of 45/42% from the American public – not too shabby for a guy who is famous for his lack of discipline, frequent gaffes, and over-the-top theatrics.


Despite all this, Joe Biden and his supporters should exercise cautious optimism regarding early 2016 polling, if any optimism at all. A comparison of his current head-to-head numbers with Al Gore’s in 1997 indicates Joe Biden is slightly weaker than the former Vice President was at a comparable point in the 2000 presidential election.

Thursday, April 4, 2013

Rand Paul's 2016 GOP Primary Poll Bounce Has Arrived, Courtesy Of An Old Fashioned Filibuster

A television in the U.S. Capitol building catches Rand Paul's filibuster of CIA Chief John Brennan, as it occurs on March 6, 2013. The filibuster catapulted Rand Paul into serious contention for the 2016 Republican presidential nomination. Courtesy of Corbis
PPP confirms that Rand Paul has become the first GOP candidate of the 2016 cycle to shake up early primary polling.

Since April of 2012, Public Policy Polling has surveyed a hypothetical 2016 Republican Presidential Primary race five times nationally, with Marco Rubio leading 4 of those times in a crowded nine-candidate field with no more than 22%, and no less than 18% of the vote. Chris Christie led the only other time, in PPP's 1st poll on the race, with 21% (which has since slipped to 15%).

Besides that, the early primary race has naturally remained quiet, with Rand Paul, among several others, staying in single digits; the dreaded Tier 2 status.

That all changed on March 6, 2013, the day twitter and the national media lit up with news that Rand Paul was staging one of the first genuine, old-fashioned Senate filibusters in years, forcing Americans to consider whether the White House was abusing it's executive power regarding drone warfare in his opposition to CIA Chief John Brennan.

Yes, thanks to the filibuster heard 'round both social & traditional media, it appears we've seen our first true "bounce" of the 2016 primary season, at least according to PPP's recent national survey conducted March 27-30, 2013. Senator Rand Paul has jumped into Tier 1 status, leap frogging Paul Ryan, Jeb Bush, Chris Christie, and Mike Huckabee to place a very respectable 2nd in a 9 person field. Furthermore, Quinnipiac was out yesterday with their FIRST national look at the GOP primary race, and have Paul in 3rd place with 15%, just behind Paul Ryan (17%) and Marco Rubio (19%).

And Rand Paul's bounce hasn't been isolated to national polls. He averaged just 8% with Republican primary voters in 2016 state-polls conducted since last year, while post-filibuster surveys have shown him in 2nd place in Pennsylvania (17%), and 3rd place in Florida (where he's expectedly being squeezed-out by home-staters Jeb Bush & Marco Rubio).

So we're agreed. Rand Paul has seen a boost in support nationally (& state-by-state) since early March, likely due to rabid media coverage of his old-fashioned, not leaving-the-floor-to-pee filibuster. But who exactly likes Rand Paul, in terms of the Republican Primary electorate? Where did his sudden jump in polls stem from? According to PPP's nat'l survey cross-tabs, it came from conservative Republicans:


Rand Paul experienced large jumps in support from both "very conservative" and "somewhat conservative" Republicans, while his level of "moderate/liberal" support remained static compared to pre-filibuster PPP national averages. In fact, as the above chart indicates, Paul ranks 2nd out of nine among "very conservative" Republicans in PPP's new national survey, as well as 2nd among "somewhat conservatives." Ironically, despite his call for more individual liberty in the Republican party at this year's CPAC convention, he ranks 5th of nine among self-identified "moderate or liberal" Republican primary voters. It will be interesting to see if the Libertarian's call for a "new Republican Party" ends up boosting his percentage with moderates/liberals; it certainly doesn't appear to have hurt him with conservatives. If he were successful at getting his support among moderates/liberals to his level of support w/ conservatives, he'd easily replace Marco Rubio as the GOP front-runner.

Wednesday, April 3, 2013

2008 vs. 2016 Democratic Primary Contests: A Comparison of Hillary's "Inevitability" THEN and NOW

Contrary to what some believe, the Hillary Clinton of 2008 was not nearly as strong in Democratic primary polling as she is today. Photo courtesy of businessinsider.com (left).
 Its been eight years since the Democratic Party has seen a competitive primary contest, but the similarities between this point in the 2008 presidential cycle and today are undeniable; Hillary Clinton is the obvious Democratic standard-bearer, she has a major lead against her possible primary contenders, and the sense of inevitability surrounding her eventual coronation is strong and near-universal.

But for all the comparisons between Hillary '08 and Hillary '16, there are a number of differences. In 2008, she was running AGAINST eight years of Republican reign that had become amazingly unpopular with the American public. This time around, she'll be running to continue the legacy of what has been, based merely on presidential job approval ratings, 8 years of a mediocre presidency.

Furthermore, today, the mere thought of having to compete against a more-popular Clinton-juggernaut has essentially frozen the Democratic Primary field (with the sole exception of the little-known and ambitious Governor of Maryland, Martin O'Malley). In 2005, there was no "frozen field" to speak of. The newly unemployed John Edwards made moves almost immediately following his failed Vice Presidential bid to indicate he was starting a 4-year-campaign for the presidency. Questions abounded regarding the intentions of Sen. John Kerry, the unsuccessful '04 Democratic nominee that only lost by a respectable 2.5 pt margin. The much aggrieved 2000 nominee and former Vice President Al Gore was lurking in the background, as well as 2004 grass-roots super-star and one-time favorite for the nomination, Howard Dean. In the end, only 1 of the above mentioned names jumped into the 2008 primary, but unlike today, potential candidates were making some not-so-under-the-radar movements towards a presidential bid.

Perhaps the most significant difference between the 2008 and 2016 presidential presidential cycles to date lies in the polling. The chart below shows the monthly polling averages of the Obama v. Clinton primary battle from immediately following the 2004 election to the conclusion of the Democratic primary in June 2008, divided into two periods: Nov. 2004 through the Iowa Caucus, and the Iowa Caucus through Hillary's campaign suspension in June. The information in the chart is based off of about 350 surveys compiled from pollster.com, real clear politics, and Wikipedia. The excel file including the 350 survey data-set can be viewed here. To be included in the data set, a 2008 poll must have tested both Hillary Clinton and Barack Obama in the hypothetical primary contest. Where I was able to track down a survey's cross tabs, a demographic break down of the Hillary/Obama vote is provided, though you'd be surprised as to how difficult it can be to track down obscure, 5-year old cross tabs.
For a full list of the surveys used in compiling the averages, go here.

As you can see, Hillary enjoyed a healthy 16 point lead over Barack Obama during the early stages of the 2008 primary (39-23%), before any contest was held; you know...the period in which pundits were discussing her apparent inevitability. Which begs the question, at least in the context of polling: what was so inevitable about a 16 point lead, especially when the leader was well below 50%?

Saturday, March 30, 2013

Shorter Quinnipiac poll: If Ken Cuccinelli is too partisan or extreme for Virginia, someone forgot to tell the voters.

Courtesy of Greg Skidmore
Virginia Attorney General Ken Cuccinelli has been on the receiving end of attacks from the right and left regarding his viability as a 2013 gubernatorial candidate. Democrats think he's a dangerous ideologue who will place purity to the conservative cause above the well-being of citizens of the Commonwealth. Some Republicans, especially Jennifer Rubin of the Washington Post, think he's a weak candidate who is running a low-key at best, inept at worst campaign.

But if the somewhat limited polling on the 2013 Virginia Governor's race to date is any indication, Virginia voters are either unaware that the man they call the "Cooch" is a brash ideologue headed for certain defeat, or are willing to support him regardless.

Take for example the recent Quinnipiac University poll on the 2013 Virginia Governor's race. Cuccinelli leads Terry McAuliffe 40-38%, his first lead in any Quinnipiac poll of the race to date. But the better news for Cuccinelli lies in the trend lines. In Quinnipiac's first survey of the race in November of last year, McAuliffe (D) led Cuccinelli by four points. In the follow-up poll from January, his lead had dropped to 1 point. In February, the two were TIED, and last week, Cooch grabbed his first lead. He also leads McAuliffe among Independents by 37-29%, and sports a +6% overall favorability rating with all Virginia voters (34/20%), though a large plurality don't yet have an opinion on their attorney general (46%). McAuliffe is at +4%, with a whopping 63% who are unsure.

By only 5 points, Virginians say Terry McAuliffe has the right kind of experience to be Governor, while voters say the same of Cuccinelli by 20 points.  And despite all the talk of Ken being an ideologue, a slight plurality of voters say his ideology is "about right," while just 29% say he is "too conservative." For what it's worth, that's the same percentage that say McAuliffe is "too liberal."
Even more so, Virginians approve of the job their attorney general is doing by a large margin, 45/27%. Pretty impressive for a conservative firebrand in a blueish-purple state.  His job approval rating has a higher net margin than that of newly elected Democratic Senator Tim Kaine (47/33%), and only slightly behind Sen. Mark Warner (D) (56/26%), and Gov. Bob McDonnell (53/26%) . That high job approval rating, if it stays there throughout the campaign, could translate into vital support this November.

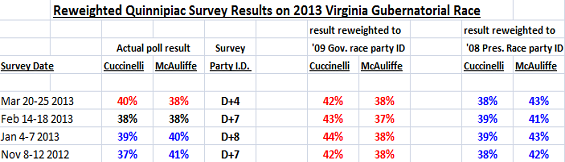
The Cuccinelli camp can find further reassurance in the Quinnipiac cross-tabs on partisan identification. Survey respondents identified as 30% Democrat, 26% Republican, and 35% independent, a good deal less Republican than partisan self-identification in the 2009 Governor's race (37% Republican, 33% Democrat, 30% Independent). Had the Quinnipiac survey found party I.D. to be the same as November 2009, all other findings remaining the same, Cuccinelli would take a larger 42-38% lead.

The chart below compares actual Quinnipiac findings to reweighted partisan identifications: the 2009 Governor's race and the 2012 presidential race. This should provide us with a sort of partisan I.D. floor and ceiling, as Republicans are unlikely to see better than R+4 turnout in November, and Democrats are unlikely to see better than D+7 (party ID in VA. in the last presidential election):


Obviously, if the November 2013 Virginia electorate resembles 2009's electorate, Ken Cuccinelli will likely have a good election night. But if it looks anything like it it did in the presidential election last November, the former head of the Democratic National Committee will likely be Governor.

Which electorate are we likely to see? It's hard to say, but it's probably smarter to compare the upcoming gubernatorial electorate to the last gubernatorial race, given that Obama won't be on the ticket when voters head to the polls in 7 months.

...One final note regarding Cuccinelli's current standing in polls against McAuliffe: he's not doing that much worse than Bob McDonnell at this approximate stage in the 2009 Governor's race. And he went on to win his race by a landslide. The chart below compiles every poll taken on the 2013 Governor's race to date, courtesy of TPM poll tracker, Pollster, and Real Clear Politics:

Wednesday, March 27, 2013

Hillary Tops 70% With Moderates Against Home-Stater Marco Rubio In Recent Florida Poll

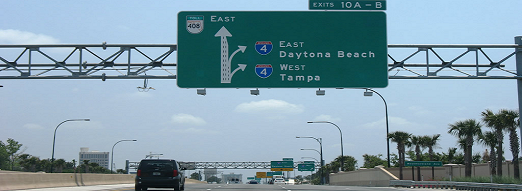
The I-4 Corridor, which runs West-to-East across the Florida peninsula, connecting Orlando and Tampa, is one of the most sought after swing-regions within a "swing-state" in the country.

As I wrote yesterday, Public Policy Polling has a new 2016 poll on the perennial swing-state of Florida. But their swing-state status won't look all that "perennial" if Hillary Clinton has anything to say about it. She leads 3 likely 2016 GOP contenders, former VP nominee Paul Ryan (54-41%), ex-Gov. Jeb Bush (53-40%), and Sen. Marco Rubio (56-40%), demolishing them among Independent AND Moderate voters.

Yes, Hillary Clinton leads two reasonably popular HOME-STATE politicians...by double digits...in a state that hasn't seen a presidential candidate win by such a margin since 1988 (and even then, it was a Republican that accomplished the feat).

If PPP's results are actually borne out, Hillary would far outpace her husband's 48-42% victory over Bob Dole in 1996, the highest winning margin of any Democrat in Florida since exit polling became easily available in 1976. She would make Obama's back-to-back 50-49% & 51-48% wins in 2012 & 2008 look like the work of a political amateur. Her margin over the 3 Republicans in Florida looks the most similar to Ronald Reagan's performance in the state in 1980 (which he captured from Jimmy Carter, 56-39%).
To better understand the significance of a potential double-digit Florida win for Hillary, consider the chart below of Florida presidential election results since 1976:

* Unfortunately the Roper Center has a pay-wall in place to access their state-by-state exit polling. CNN and other networks only provide state-level exit polling back to 2004, and select numbers from 1992 & 1996. Thus, the incomplete data re: the moderate vote in Florida through the years.

Where exactly does Hillary's peculiar strength in such a quintessential swing-state stem from? The PPP cross tabs have her winning around 85% of self-identified "liberal voters," pretty close to Obama's numbers in the state against Romney last November. She manages about 20% of the "conservative" vote, also similar to Obama's 2012 margin.

Nothing in particular stands out until you glance at the vote break-down of "moderates." Hillary doesn't just beat the GOP. She wipes the floor with them:
  • She's +47% with moderates in a hypo against Paul Ryan (69-22).
  • She's +30% with moderates in a hypo against Jeb Bush (61-31).
  • She's +48% with moderates in a hypo against Marco Rubio (71-23).