
 |
| John McCain, seen here with Va. Gov. Bob McDonnell in Oct. '09, wound up being a valuable asset to the campaign. Of the Virginians that voted on election day '09, 51% said they supported him in '08. Photo courtesy of Preston Gannaway & The Virginian-Pilot |
At the same time, PPP finds the Virginia electorate remains largely unchanged as well. Five months ago, Democrats held a 3 point partisan identification advantage (35% Dem, 32% Rep, 32% Ind), which is now down to one point (34% Dem, 33% Rep, 33% Ind). The racial identification findings from January and now are virtually identical (74% white, 18% black, 8% other), as well as ideological I.D., age I.D., gender, and '2012 vote'.
But how does the PPP electorate compare to the one found by exit polls in 2009, when Republican Bob McDonnell defeated Democrat Creigh Deeds in a landslide?
In most ways, it's similar, with one big exception.
White voters comprised a slightly larger slice of the electorate in '09 (78%) than what PPP finds now (74%), but not enough to significantly alter the poll results. The 2009 race featured an R+4 party I.D., while PPP finds D+1 (again, the difference is not enough to substantially change the survey result if reweighted). PPP also finds a larger gender turnout gap than seen in 2009, as well as a slightly older electorate, but nothing that would change the fundamentals of their topline.
The one exception to the above paragraph can be seen in the crosstab regarding the 2012 vote. Often times, pollsters will ask respondents who they voted for in the previous presidential election, mostly to get an idea of how the pool of survey takers compares to the prior presidential electorate (this question was frequently used in survey analysis in the run-up to the South Carolina 1st Congressional District special election between Mark Sanford and Elizabeth Colbert-Busch to gain insight into the strength of GOP turnout).
As has been noted here before, off-year, non-presidential races have a tendency (though not always) to attract less Democratic friendly electorates than in presidential years (see the 2010 vs. 2008 general election exit polls). But that is not the case in either of PPP's Virginia Governor polls. In both surveys, 49% of respondents say they voted for Barack Obama in 2012, while 45% claim they supported Mitt Romney. 6% say they supported someone else, or do not remember. That's an identical margin to the actual result in Virginia last November, when Obama carried the state 51-47%.
The '2012 vote' finding may not seem so surprising until you consider what the 2009 Virginia Governor electorate looked like in comparison to the 2008 Presidential vote. That year, Virginia voters told exit pollsters they supported John McCain over Barack Obama in the 2008 presidential election by a fairly substantial 51-43% margin. Interesting thing is...John McCain LOST the state of Virginia in 2008 by an equally substantial 53-46%. In other words, the Virginia electorate shifted 15 points towards McCain voters between November 2008 and November 2009.
Now obviously, non-presidential year electorates are not uniform. But the pattern of off-year elections in Virginia fearturing more Republican presidential voters than Presidential elections played out again in 2006 (unfortunately, there are no exit polls available for the 2005 and 2001 VA Governor races). That year, Democrat Jim Webb barely edged out George Allen for the Senate seat, at the same time as Virginia voters said they supported George W. Bush over John Kerry in the previous election by a 52-42% margin. The actual 2004 Virginia presidential result? Bush beat carry by 8 points. So 2006 counts as another non-presidential year contest where voters claimed to have voted for the Republican in the previous presidential election by a larger margin than they actually did.
Understanding that no particular demographic crosstab should be considered in a vacuum, what would the PPP topline look like had they found an electorate that was equally more supportive of the Republican candidate from the previous presidential election as in 2009? In other words, how would the result change had PPP found the Virginia electorate voted 52% for Mitt Romney and 41% for Barack Obama (a net 15 point shift towards the Republican candidate, like seen in 2009):
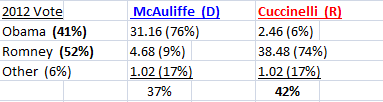
Unlike the above mentioned minor differences between PPP's crosstabs and 2009 exit poll findings, reweighting the survey's '2012 vote' to mirror a 15 point Republican shift causes a drastic change in results. As opposed to McAuliffe being ahead 42-37%, the numbers are completely reversed, with Cooch winning 42%, to McAuliffe's 37%, a 10 point shift.
PPP's '2012 vote' finding in the Virginia Governor's race is not set in stone. In fact, as we learned from the SC-1 special election, it can change drastically from week to week. But if their current finding holds, it would represent an electorate that is identical in make-up to the 2012 presidential election results, whereas the 2009 gubernatorial race saw an electorate that shifted 15 points in favor of the Republican candidate from the 2008 election.
Whatever the true nature of who likely Virginia Governor voters supported in 2012 at this point, both the Democratic and Republican candidates are within 5 points of each other. With 5 months until election day, it's still anyone's race.
I think it's endearing that you're still re-weighting polls despite that whole idea, and many of your 2012 posts, being so publicly humbled. Keep at it champ, you never know when you might stumble on a winner.
ReplyDeleteI'll try to address your comment (as veiled as it was):
ReplyDeleteI believe you misunderstood the point of my post. It's a purely hypothetical scenario that harms no one, and as the table notes, is mathematically sound. Quite simply, all other findings remaining the same, HAD PPP found an electorate as Republican as exit polls indicated in 2009, their findings would have been what I presented. Infer as you wish, but no where do I suggest that PPP's findings are incorrect or wrong. I do raise the idea, as anyone could themselves, that things could change drastically.
As I note in the description of this site, the blog is intended to examine polls through a what-if perspective, and no part of that is meant to imply that poll findings are wrong whenever they are "reweighted." If I think a particular polls findings are bullshit, I'll say it outright. I repeat, reweighting a poll for the purposes of this website DOES NOT mean I think the pollster's findings are wrong.