Showing posts with label Gallup. Show all posts

Tuesday, March 24, 2015

Polling Update: Hillary Clinton's Image Dinged In Wake of Email Scandal, Though The Injuries Are Minor

Photo courtesy of Yana Paskova/Getty Images

In the seemingly never-ending spectacle that is the modern day presidential campaign, the month of March 2015 will likely be remembered for the New York Times story revealing Hillary Clinton skirted State Department rules requiring work-related email retention. The fact that the former New York Senator was conducting government business over a private, in-home family email server dominated 2016 news for days afterwards. Naturally, three weeks into this story, the headlines and questions have taken a toll on Clinton's image.

The days of soaring, rockstar-like favorability ratings have come to an end for Mrs. Clinton (though this trend was emerging even before 'emailgate'). In fact, her post-scandal numbers more closely resemble the contentious days of the 2008 Democratic Primary than the lofty highs from her stint as Secretary of State.

Of the nine surveys to measure Clinton's favorability rating before and after the email scandal broke, all but one found her net favorable rating had dropped in its aftermath. The one that did not was conducted March 1-5, even though the email story broke late in the day on March 2, and didn't reach peak media fervor until days later. The poll was also completed five days before Hillary's largely-panned press conference on March 10.

Beyond the NBC/WSJ poll, Clinton's net favorable rating dropped anywhere from six to twenty-four points before and after the story broke. Economist/YouGov has taken two polls since the Clinton scandal broke, and has measured the smallest drop (from 52/44% on July 7-10, 2014, to an average 48/46% post-controversy).


The post-controversy Economist/YouGov numbers represent an average of two surveys, one conducted on March 14-16 and March 21-23, 2015.

Public Policy Polling, of all pollsters, measured Hillary's largest favorability drop. Granted, their pre-email story survey is two years old. Regardless, a 56/37% to 43/48% drop is stark nonetheless.

Clinton averaged a 52/38% favorable/unfavorable rating among pollsters that tested her favorability both before and after the email story. She averaged 46/43% after the story broke.

Other pollsters measured the effect of the email story on Hillary's public image in different ways, and the results are more mixed for the former First Lady.

Economist/YouGov, for example, conducted extensive post-email polling on Clinton, and found doubts about her sincerity up sharply from last year.

On the other hand, a Republican pollster found that just 36% of Americans have a less favorable view Mrs. Clinton as a result of the email scandal. Twenty-nine percent say the same in a recent CBS News survey. For comparison, 45% held a less favorable view of Mitt Romney as a result of the infamous "47%" remark in the early fall of 2012. Thirty-two percent felt the same about Barack Obama's 'You didn't build that' remark earlier that same year.

Furthermore, Hillary's outstanding numbers in the 2016 Democratic Primary are still in great shape:

*The pre-email scandal PPP poll in Wisconsin included former home-state Senator Russ Feingold as a 2016 Democratic Presidential primary candidate, while the post-email scandal survey did not. ^The post-controversy Economist/YouGov numbers represent an average of two surveys, one conducted on March 14-16 and March 21-23, 2015.

And while Mrs. Clinton's lead over her potential 2016 GOP contenders dropped across the board in the latest CNN poll, she still maintains double-digit leads against all of them.

It may sound fair to say the Clinton's are nothing if not deceitful. But as they've shown time and time again, they are resilient as well. While emailgate has undoubtedly been unhelpful for Hillaryland, it's not as bad as it could be, and seems far from fatal. Absent new information, Clinton will survive with minor scrapes and bruises.


Updated on March 25 to include new St. Leo University, PPP, Economist/YouGov, and CBS News polls. 

Tuesday, April 22, 2014

President Hits 6-month Job Approval High on Gallup and RCP

Photo courtesy of The Guardian.

Today's Gallup tracking update fits nicely with the new Democratic narrative that, just maybe, despite years-long conventional wisdom, Obamacare and its creator aren't as doomed as originally thought. For the first time since their October 8, 2013 update, President Obama's job approval rating came within two points of matching his disapproval rating on Gallup.


In the intervening period since October, the President's net approval (the difference between his approval and disapproval rating) has ranged from -4 (on April 19-20 and March 19-20), and -16 (on March 1-2 and March 15, 2014). Furthermore, today marks only the second time since October 8 that Obama's approval rating has reached as high as 46% (the other time being on February 20). Today also marks the first time since October 8 the President's job DISAPPROVAL rating dropped below the 49% level.

You have to go all the way back to September 26th to find the President's net job approval higher than it is now. And unfortunately for Republicans, the Gallup daily tracker isn't the only pollster showing Obama's job ratings improving from months ago. Check out his RCP and Pollster averages. Obama's at his best net average job rating since October 29 per the former, and since September 24 per the latter.

There are two obvious theories behind the ratings change: 1) the outrage over the Obamacare website's failures and canceled insurance policies, which began in early October, roughly around the same time as Obama's approval rating drop, is subsiding. Though the evidence for this seems split at best. 2) The Gallup tracker has a history of bouncing around on a day-to-day basis, which is most likely all we're seeing in today's numbers. Afterall, the President was at 42/52% on April 16, just six days ago. And over the course of two days earlier this month, the President's job rating fell from 45/49% to 40/55%, a net drop of eleven points. On the other hand, Obama's WEEKLY average job approval (which is a better metric for spotting trends), is the lowest its been in two months, even before factoring in today's lofty 46/48% figure. You have to go back to the week of September 29 to find a higher average weekly net job approval for the President.

In the end, remember, we're talking about Gallup's daily tracker. It can be erratic, sometimes wildly so. But today's numbers, taken in the context of most recent national surveys, bode well for Democrats.

Thursday, October 10, 2013

"Internally Splintered:" Gallup Reiterates Fact that Democrats Are Fond Of Themselves, Republicans More Self-Critical

Gallup analysis confirms a long-running trend of Republicans being more harsh on their own party than Democrats with theirs, and points the blame at "internal strife." If there is any "strife," it exists between the groups represented above, with (from left) Demint, Cruz, and Limbaugh representing the Tea Party/Heritage wing of the party, and Boehner, Peter King, and Karl Rove representing the "GOP Establishment." Photos courtesy of Donkey Hotey.

Twitter lit up once again this afternoon when the Gallup organization released an attention-grabbing headline: Republican Party Favorability Sinks to All-Time Low. And below is just a small sample of reactions to the news.


How bad could it possibly be, you ask? Precedent-setting awful, that's how bad. Barely over one-quarter of Americans have a favorable view of the Grand Ole Party (28%), while roughly two-thirds view it unfavorably (62%). And as Andrew Dugan of the Gallup organization notes, it's the lowest popularity rating for Republicans OR Democrats since they began polling the question twenty-one years ago.

For their part, the Democrats are also near-record setting popularity lows (43/49%). They just have a much higher floor than Republicans.

The Gallup numbers would be a little easier for Republican spinsters to dismiss if it weren't for the fact that similarly poor numbers are popping up all over the place. But Dugan also cites a particular phenomenon in the Gallup press-release that might provide a bit of relief for fretful Republican campaign operatives across the country:

"Self-identified Republicans are more than twice as likely to view their own party unfavorably (27%) as Democrats are to see their own party unfavorably (13%). . . These findings may be consistent with the widely circulated narrative that the Republican Party is internally splintered on how best to handle the budgetary negotiations."

This phenomenon isn't limited to the new Gallup poll, either. Consider the chart below, which documents how consistently Republican voters have offered up less favorable or approving views of their own party than Democrats, at least over the course of the last several months (please keep in mind that only polls with readily retrievable crosstabs could be used in the tabulation):

*denotes survey asked poll respondents whether they approved or disapproved of the Republican or Democratic Party, rather than whether they felt favorably or unfavorably toward the party.

Tuesday, July 23, 2013

Bill Clinton, George W. Bush, & Barack Obama: Comparing Presidential Favorability with Job Approval

President Clinton stands apart from Presidents Bush and Obama in that his job approval rating varied widely from his favorability ratings at times during his presidency. Bush and Obama have seen no such variation.

About a month ago, Gallup released a survey on former President George W. Bush that received a surprising amount of attention - for the first time since April 2005, before Hurricane Katrina turned his personal popularity upside down for the remainder of his presidency, the once deeply unpopular former President saw his favorable rating surpass his unfavorable rating (49/46%).

Notable not only for the incredible duration of his unpopularity, his most recent Gallup standing represents a 31 POINT shift in Bush's net favorable/unfavorable rating since shortly after leaving office, when he clocked in at a dismal 35/63%.

So there you have it. A man who was disliked by super-majorities just four years ago now finds public opinion split on the subject. And while his rating is lower than both the current President's (who last found himself at 55/43% in a Gallup survey), and his predecessor's (who was at 69/27% last August), it's still a bit hard for this political junkie to fathom the guy that even Republicans had lost faith in could possibly be viewed favorably by a near majority of the country.

But lets not make more of this survey than it actually is, as several mostly conservative pundits and bloggers did by claiming the results confirmed George W. Bush was somehow more popular than Barack Obama.

Where did conservatives go wrong in making this assertion?  They made the mistake of merging the meaning of favorability with job approval by assuming that Obama's 47/44% job rating (as reported by the Gallup daily tracker on June 11th, the day the Bush favorability poll was released) was the same thing as Bush's favorability rating (as measured June 1-4, 2013).

It's not.

Asking a voter whether they view an individual favorably or unfavorably is different in both language and meaning than asking a voter if they approve or disapprove of the job someone is doing.

For example, President Obama's most recent favorability rating, as measured by Gallup in April of this year, put him at a fairly strong 55/43%. The Gallup daily tracking poll taken at the same time put his job approval rating, however, at a less impressive 48/46%. George W. Bush left office with a poor 40/59% favorability rating, but an even worse 34/61% job approval rating. Gallup's final survey of President Clinton's favorability, while still in office, was December 2-4, 2000, and found him at an impressive 57/41%. But Americans were even more fond of the job Clinton was doing as President than they were of him personally, with 60% expressing approval, and 35% expressing disapproval.

So a few bloggers got it wrong in asserting that Bush is now more popular than Obama, as job approval is not precisely predictive of favorability. But "precisely" is the operative word there.

A close comparison of the entirety of polling on the favorability and job approval ratings of the last three Presidents illustrates that while favorability and job approval ratings are not mirror images of one another, they travel in fairly close lock-step, with only one exception: Bill Clinton from 1998-2000.

Just consider the chart below of President Barack Obama's national favorability and job approval averages since taking office in 2009, broken down into four month periods, or thirds of a year:

Data includes 410 favorability surveys taken from January 20, 2009-present, and 645 job approval surveys, compiled from Polling Report, Real Clear Politics, and TPM Poll Tracker.

As the averages illustrate, Obama has maintained a slightly higher favorability rating than job approval rating throughout his presidency. But the trends, the dips and bounces, match up pretty closely, as the below line graph of the above data illustrates:


With the exception of the first year of his Presidency, Barack Obama's job approval/disapproval and favorable/unfavorable ratings have rarely deviated from the 50% level.

And while George W. Bush's overall trends were much different than Obama's, the pattern of favorability rating tracking closely to job approval was even more apparent throughout his 8 year presidency. See the tables and charts below of his ratings, averaged into 4 month increments.

Data includes 485 favorability surveys taken from January 20, 2001-January 20, 2009, and 1,428 job approval surveys, compiled from Polling Report and Real Clear Politics.


Thursday, April 11, 2013

The Predictive Power of Presidential Job Approval on Election Outcomes, according to 1978-2012 Exit Polling

Presidential Job Approval based on exit polling, 1978-2012
It's been posited by some that a president's job approval rating is a pretty decent predictor of eventual election outcomes. But study's that have looked at this before tend to base their findings on pre-election political surveys on who says they will vote, rather than exit poll data that surveys actual voters.

A look at what exit polls have reported on past presidential job approval shows that while attitudes towards the President's job performance are occasionally on-the-mark with regards to the national popular vote, they're not always. For example, voters are frequently willing to vote AGAINST a President or his party's nominee whose job performance they APPROVE of.

More than that, exit poll findings regarding a president's job approval are far more predictive of actual results when an incumbent is seeking re-election, as opposed to the incumbent party's nominee seeking election.

Job performance also tends to be less prognosticative of actual results in midterm elections, as opposed to Presidential, while the President's APPROVAL rating is more likely to reflect his proportion of the vote than his DISAPPROVAL rating is to reflect his opponent's vote share.
The chart below documents the President's job approval rating in every presidential and midterm election since 1978. From 2004-2012, exit poll data from CNN is relied upon. From 1978-2002, exit poll data is provided by Samuel J. Best and Brian S. Krueger's Exit Polls, Surveying the American Electorate, 1972-2010, with the exception of 1988 data, which was retrieved here. Unfortunately, exit pollsters did not ask voters their opinion regarding presidential job approval in 1980, 1984, 1992, and 1996. Thus, in 4 of the 18 elections examined in the chart below, the President's job approval rating is based on the final Gallup Poll taken prior to that election, not exit poll data.

* indicates the President's job approval rating for this year is based on Gallup's final pre-election poll. All other findings come from exit poll results. Red indicates a Republican election victory, blue indicates a Democratic election victory. "H" means "House." "S" means "Senate." House and Senate votes tallies are provided by USHouse.gov

As the chart indicates, excluding midterm elections, voters have frequently voted against Presidents they approve of. A solid 54% majority approved of the job President Barack Obama was doing as they headed to the polls on Nov 6, 2012, but the President only won 51.0% of the vote.

Tuesday, March 12, 2013

Obama Administration's "The Sky Is Falling" Antics Catch Up To The President's Job Approval Rating

Stock Photograph by White House Public Domain
Yesterday, a new McClatchy/Marist survey was accompanied by the following headline: "...Obama Tumbling in voters' eyes." Their conclusion was based on the fact that Barack Obama's job approval rating has fallen to it's lowest point since November of 2011, at 45/48%, while only 34% say the country is on the right track (62% say it's on the wrong track). Their previous survey from early December 2012 had shown the President in positive territory, with 50% of Americans approving of the job he was doing as President, and just 44% disapproving.

Unfortunately for Obama, the McClatchy/Marist poll is not an anomaly. In fact, the vast majority of pollster's who have examined the President's job approval rating since his reelection have found a decline in his numbers, especially since the sequester took effect just two weeks ago. Consider for example the two daily tracking polls, Gallup and Rasmussen. Before March 1st, the day the budget sequestration officially went into effect, Barack Obama managed an average daily job approval rating of 52/42%, a net +10 points, since his reelection. But an average of Gallup surveys taken after the sequester shows his job rating has fallen to 48/45%, a net decline of 7 points. Meanwhile, the Rasmussen daily tracking survey shows Obama has averaged a 51/48% job approval rating since the sequestration went into effect, compared to a 54/45% job rating from his reelection to March 1st.

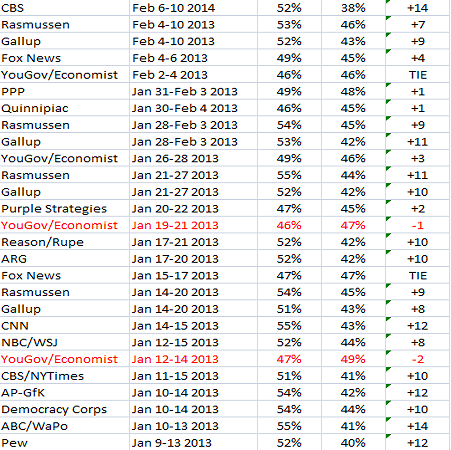
The chart below compiles a list of every polling survey on Barack Obama's job approval rating I could find. While poll trackers like Pollster and TPM are helpful, they are often incomplete, excluding various pollsters for particular reasons. The below chart is more complete than any single 1 of the poll trackers, and compiles Barack Obama's average job rating from his reelection last November to today:
**Job approval info courtesy of TPM poll tracker, Huffington Post Pollster, pollingreport.com, and random personal searches.
***Rasmussen and Gallup track the President's approval rating daily. As a result, their numbers in the above chart represent weekly averages.

Friday, December 21, 2012

Despite Media focus on Guns, Americans have other ideas for dealing w/ school shootings

 Protestors interrupt NRA president Wayne LaPierre today during a press conference addressing the Newtown, CT shootings. (Credit: Getty)

In the wake of the Newtown, Connecticut massacre, Gallup has some interesting poll findings. Despite a media that has been all-gun control, all-the-time since the tragic December 14th shooting, the American public apparently thinks there are better ways to respond: