Showing posts with label Election 2010. Show all posts

Tuesday, October 14, 2014

Once Thought Vulernable, Nikki Haley Looks Poised For A Big Win – But There’s A Caveat…

Photo courtesy of the A.P.

There was a time when South Carolina Governor Nikki Haley looked like she would have serious trouble in her bid for reelection, even as recently as this June.

Her problem was multipronged. First, she was never elected by an overwhelming mandate to begin with, kind of stumbling across the finish line in 2010 with an anti-climactic 51-47% victory during an incredibly favorable election cycle. That somewhat meek level of support transferred over into Haley's job approval ratings. Then came her frequent quarrels with the South Carolina legislature, a feature of her tenure which began early on after announcing she would be issuing "report cards" to S.C. lawmakers on criteria determined by her, and culminated in the summer of 2012 when the Republican legislature overrode a number of Haley's budget vetoes.

And of course, who can forget the proverbial cherry-on-top of her first two years in office - the hacking of four million South Carolinian's social security numbers.

All of those missteps aside, more recent events would tend to suggest that Haley is going to weather the storm.

Not long ago, Haley took the opportunity to barnstorm the state, bragging about future business investments that are expected to bring lots of job creation to South Carolina. Couple that with a steady unemployment rate decline from 10.5% upon taking office in January 2011, to 6.4% as of September, and a smoothly handled Senate confirmation process for the newly appointed (and popular) Sen. Tim Scott, Haley seems back in the game.

And polling bears that out.

A base that once appeared unsure of Haley from a polling perspective, has returned home in full. Republicans aren't the only ones to take note of Haley's accomplishments. Her job approval rating with ALL South Carolinians is the highest its ever been. Sixty-two percent of likely voters say the state's economic condition is getting better, versus just thirty percent who say it's getting worse.

Then come the head-to-head numbers, which seem to look better everyday. After starting out trailing her Democratic challenger Vincent Sheheen in a 2012 poll, she's been ahead in every survey since. She's ahead by double-digits in practically all of the non-Democratic Party affiliated polls of likely voters. Gov. Haley leads 49-37% in the Ace Of Spades Decision Desk average, leads 50-38% in the Huffington Post Pollster average, and leads 50-37% in the Real Clear Politics average.

Tuesday, September 23, 2014

Loving To Hate Pat Quinn: Why An Unpopular Democratic Governor Stands A Decent Chance At Re-election

Gov. Quinn struggles to meet-and-greet supporters as union members protest his policies at the 2012 Illinois State Fair. Photo courtesy of the A.P.

There have been twenty-two surveys of the 2014 Illinois Governor race since Republican businessman and challenger Bruce Rauner captured his party's nomination in March. Governor Pat Quinn has led in only two of them, averaging 39% across all twenty-two polls (a number that should strike fear in the heart of any incumbent).

The Huffington Post Pollster average puts the challenger ahead 46-44%, and gives Rauner a 53% chance of defeating Quinn in November - again, making it very clear that Quinn is receiving no benefit whatsoever from the power of incumbency. In fact, from a purely polling perspective, Quinn is one of the most vulnerable Governors and/or Senators in the country. His job job approval rating is awful (see here, here, & here as well). Only Tom Corbett, Sam Brownback, Dan Malloy, and Mary Landrieu trail their opponents by a larger margin on Pollster.

Fortunately for Democrats, Pat Quinn has proven himself quite resilient in the face of awful polling and brutal political headwinds before.

Look no further than four years ago, when after a bitter contest and razor-thin victory in the Democratic primary, Pat Quinn was elected to his own full term as Governor, having stepped into the role in 2009 after former Gov. Blagojevich was famously removed from office. His job approval ratings that year were disastrous, even on the eve of the election. The general election head-to-head numbers were horrendous. Of the thirty-three publicly released polls following the Feb 2, 2010 primaries, Quinn trailed his Republican challenger in ALL but two. The final Pollster average in 2010 found Bill Brady (R) ahead by eight points. The final RCP average found Brady up five points. Pollster and Real Clear Politics even picked up on a last minute surge for Brady! They were obviously wrong, as Governor Quinn went on to win 47-46%. And it was arguably the largest polling miss of the 2010 cycle (ranking right up there with the infamously incorrectly polled Nevada Senate race between Harry Reid and Sharon Angle).

Further complicating things for Republican chances at picking up this Governorship this year, the most prolific pollster to date in the Illinois race, We Ask America, has somewhat of a problematic track record, particularly in Illinois. Not to mention the fact that they make up 36% of all Illinois Governor polls taken since the March 18th primary. To date, their results have been highly favorable to Bruce Rauner. Out of their eight surveys taken since the March 18 primary, Rauner has led in all of them, by as little as three points, and as much as fourteen.

Great news for the GOP, right? Well, not when you consider that We Ask America's only two surveys of the 2010 Illinois Governor race found Republican challenger Bill Brady ahead by ten and fifteen points, the latter of which was Brady's largest poll lead of the entire cycle.

This isn't to pick on We Ask America. As noted above, all of the pollsters were off in this race in 2010. Rasmussen Reports final poll on October 20, 2010 found Brady ahead of Quinn by eight points, which also happened to be the final Pollster average. PPP, Fox News, YouGov, the Chicago Tribune, and literally every other pollster in the final weeks of the 2010 campaign missed the mark, and none of them projected the actual winner.

So while the Democrats are again in the position of having to defend an unpopular Governor and unpopular President in an unfriendly political environment, history would suggest you should not underestimate Governor Pat Quinn. In 2010, polling that consistently favored the Republican challenger the entire time wound up being wrong. Given that, Governor Quinn may be the happiest (and luckiest) vulnerable incumbent running this year.

One final note: the three most recent surveys are all good news for Gov. Quinn. The first Chicago Tribune poll of the cycle finds Quinn surging into an eleven point, 48-37% lead over Rauner - easily his largest lead of both the 2014 and 2010 elections. A Global Strategy Group poll done on behalf of the Democratic Governor Association also finds a rare Quinn lead of 43-40%. Finally, a nearly brand-new We Ask America survey actually finds Rauner ahead 44-41%, but notes that the new figures represent a significant tightening from their last poll just three weeks ago when Rauner led Quinn 46-37%.

Sunday, May 4, 2014

45 Years Of House Ballot Polling Finds Pollsters Typically Overstate Democrats Actual Performance

Image on the left is courtesy of Alaskans For Begich TV ad, and highlights the wealthy, mega-donors Koch Brothers support of Republican candidates. Image on the right comes from an anti-Obamacare ad sponsored by Generation Opportunity.

Glancing at the current HuffPollster and RCP polling averages, Democrats and Republicans are essentially tied on the generic House ballot question. The former finds Republicans ahead by less than half-a-percentage point, while the latter finds them down by a roughly equal margin. But don't expect the same polling dynamic that exits today to be present on election day - at least not if past generic House ballot polling dating back to 1970 has anything to do with it. And further, I'd caution against relying too much on the surveys taken in the final week before the election, too, as they've been pretty hit-or-miss themselves.

Hundreds of generic ballot surveys taken over the last 45 years and eleven midterms finds polls conducted in the Spring of an election year (April, May, and June) have overstated the eventual Democratic margin in nine of them, or 82% of the time (including the last five midterms in a row). Surveys taken in the final week(s) of a campaign are no exception, understating the Republican margin in eight of eleven elections. Consider the tables below, the first of which provides polling data in the spring of each midterm since 1970 compared to the final result, the second of which compares polling data taken in the final week(s) of the campaign with the actual result.


Polling data pre-2006 was provided by the Roper Center's IPOLL databank. * Indicates the cutoff date for polls to be included in the average was TWO weeks prior to the actual election day. ** Indicates the cutoff date for polls to be included in the average was THREE weeks prior to the actual election day. Dates were only altered if necessary to obtain a large enough sample to average.

Surveys conducted in the Spring of the last eleven midterm elections tended to overstate the eventual Democratic margin over Republicans by an average of five net points. Looking at specific elections, such as 2010, you can see Republicans were polling an average 43% in the Spring of that year, though they eventually won 51% of the popular vote. Democrats, meanwhile, were polling an average of 42% that Spring, and wound up with 45% that November. The Republican advantage over Democrats grew from just one point in April, May, and June, to six points in November.

Wednesday, October 9, 2013

Embracing Charlie Crist With Open Arms, Florida Democrats Look Poised To Bury Gov. Rick Scott In 2014

In some political parties, the desire to win trumps old disagreements, which must be the case for Charlie Crist's success with Florida Democrats in recent polls. But expect Rick Scott's team to play-up past associations like the ones above (a campaign appearance with Palin in 2008, then Obama four years later) to highlight Crist as a political chameleon.

The current state of Florida politics would be entirely unrecognizable to a to a time-traveling political observer from the year 2006. Then, a popular politician named Charlie Crist looked like a rising Republican star who drew barbs from Democrats rather than adoration. In fact, he performed down-right poorly among traditional Democratic voting blocks in his successful gubernatorial run, winning just 14% of self-identified Democrats, 21% of liberals, and 18% of African Americans.

My, how things change.

Flash forward through a bitter 2010 Senate primary campaign against Marco Rubio (which, rather than lose embarrassingly, Crist withdrew from), a failed Independent bid for US Senate, and a speaking slot at the 2012 DNC, to the man who will again seek the seat he abandoned for Washington D.C., this time as a Democrat.

And Democrats seem entirely willing to welcome him into the fold. In a recent survey, Crist attracts 85% of the Democratic vote against incumbent Republican Governor Rick Scott. He garners over 80% of liberals, and over three-quarters of African Americans - literally, the polar opposite of the coalition he built to defeat Democrat Jim Davis in 2006.

And lest you think Democrats are simply flocking to Crist as the lesser of two evils between he and Gov. Scott, he's killing it in a match-up with his only announced competitor among likely Democratic Primary voters, 59-16%. 62% of Democrats view him favorably, as compared to 43% of ALL likely Florida voters.

The sitting Governor's political evolution may not be nearly as complicated as Charlie Crist's, but his current political standing is in much more dire straits.

Unlike Crist in 2006, Scott was never elected with a real mandate from Floridians - he defeated his Democratic opponent Alex Sink just 48.9 - 47.7% in what was otherwise a wave-Republican election year. He's suffered from uniquely poor job approval ratings his entire term in office, and currently sits  at 33/55% per PPP, leading their President, Dean Debnam, to label Scott "one of the most unpopular Governors in the country. . . "

Based on his head-to-head numbers against Charlie Crist, he's also one of the most at risk of losing his seat, trailing 50-38% in the most recent poll. And the bad news runs deeper than the top line.

Pull back the curtains of the PPP survey, and you'll see that women and men, young and old, black, white, and Latino - virtually every demographic & political group surveyed prefers Crist over Scott. And despite what the information in the chart below might suggest, no, it isn't because PPP finds a much more racially diverse electorate than the one that turned out in 2010 (and in some ways, 2012).


Tuesday, August 20, 2013

Is Mark Pryor Following In Blanche Lincoln's Footsteps? Not Necessarily From A Polling Perspective

A vehemently anti-Democrat view of politics has taken hold in Arkansas, at least at the federal level, and is no doubt partially responsible for Blanche Lincoln's (2nd from left) 2010 landslide loss. And while Sen Pryor might not look quite as weak, he's no doubt in danger. Photos courtesy of Getty & Washington Post

Since 12 year Senator Blanche Lincoln (D-AR) was defeated three years ago by Sen. John Boozman (R-AR) in a 58-37% landslide, Republicans have licked their chops at the idea of turning a state recently represented in D.C. by two Democratic Senators into a state represented by two Republicans, all over the course of just four years.

Partly because of Sen. Lincoln's humiliating 2010 loss, Arkansas again looks like a top pick-up opportunity for the GOP in 2014, thanks to an eerily similar positioned Sen. Mark Pryor (D).

Like Lincoln before him, Pryor was elected to an Arkansas more amenable to southern moderate Democrats, having taken office in January 2003. And like Lincoln, Pryor's two previous Senate runs have been relative cakewalks, winning by an eight point margin in 2002, and 80% in 2008 (he was unopposed by Republicans). But also like Lincoln before him, Pryor finds himself facing talented Republican opposition at a time when Obama is VERY unpopular in the state, and not on the ballot.

In 2010, not only were Arkansans down on the federal government (74% described themselves as angry/dissatisfied with it, 25% were satisfied/enthusiastic about it), down on Obamacare (55% wanted to repeal it), and down on the Democratic Party (a 40/57% favorability rating, vs. 51/43% for the Republicans); they were also very disappointed with their President, giving him a dreadful 37/62% approval rating, with 47% "strongly" disapproving.

Unfortunately for Sen. Pryor (D), some things never change, especially in Arkansas.

They still hate Obamacare (pg. 11), still prefer Republicans to Democrats (pg. 3), and still aren't particularly fond of the President, OR the job he is doing:

* denotes the survey measured Obama's favorability rating, rather than his job approval.

Monday, August 5, 2013

Lessons from 2010, 2006, & 2002: Why You Shouldn't Read Too Much Into Early Generic Ballot Polling

Democrats are polling slightly ahead of Republicans in the generic ballot. But the GOP is still better positioned than at this point in 2009.

It's been a rough few months for President Obama, both in terms of polling and external political events.

Barely 6 months into his 2nd term, he's seen both his job approval and favorability ratings slide, while unexpected and distracting scandals involving the IRS and the NSA have angered both opponents and allies.

Yet for all the President's troubles, his party has held up well, at least from the perspective of 2014 Midterm Election polling to date.

Excluding Rasmussen Reports, the Republicans have led the Democrats in only one generic House ballot survey taken since the November 2012 election (out of 26 total polls), and have averaged a 43-40% deficit against the party that currently holds the White House and the Senate. See the table below:

*because Rasmussen tracks the generic congressional ballot every week, their numbers in the above chart are monthly averages. Data compiled from Huffington Post Pollster, Real Clear Politics, & TPM Polltracker.

The Democrats' 3 point house ballot advantage seems all the more impressive when considering the fact that the President's party very rarely performs well in second-term, midterm elections.

But try not to draw too many conclusions from the current state of polling regarding the 2014 election, especially considering the state of generic House ballot polling at this point in 2009.

From immediately following the 2008 Presidential election, until August of 2009, the Democrats averaged a House ballot lead over the Republicans of 44-38%; this, at the beginning of an election cycle in which the Republicans ultimately won the national House vote by 51-45%, and gained 63 seats in the House of Representatives.

Rasmussen & YouGov/PoliMetrix tracked the House ballot weekly. Their numbers in the chart above represent monthly averages. Data compiled from Huffington Post Pollster, Real Clear Politics, and Polling Report.

In other words, Republicans performed a net 12 points better than the average of polling at this point in 2009 predicted. Furthermore, at this point in 2009, Republicans led Democrats in only 4 of the 38 generic ballot polls taken since the November 2008 election, as compared to leading in all but 2 of the 39 surveys conducted in the final month of the 2010 election.

Wednesday, May 29, 2013

What Joe Miller's Return Means for the GOP: Alaska Senate could be the Christie v. Buono of 2014

Joe Miller and Lisa Murkowski debate just prior to the 2010 midterms. According to polling, Miller would lose to incumbent Mark Begich in a landslide in 2014. Photo by Al Grillo, courtesy of Corbis.

Caught up in a media world that that not only longs for, but demands competitive, theatrical political races, it's easy to gloss-over those contests lacking in the "drama" department. And what makes a better political contest than a close one? One where candidates are evenly matched, funded to the tee, and stir the emotions of their supporters and detractors?

But alas, the soap-opera contest cannot always be. Landslides are occasionally inevitable (usually involving a particularly strong incumbent or an unusually weak or unpopular challenger).

Sometimes, however, they're entirely avoidable. And yesterday, the 2014 Alaska Senate race took one big step closer to becoming one of those avoidable landslides for the GOP.

Yes, the Alaska Senate race features a one-term, relatively unknown Senator defending his seat for the first time in a state with a decidedly Republican slant. It's certainly not a state where you'd expect a freshman Democrat, elected by one point in a wave-Presidential year, to be in a position to win a midterm reelection overwhelmingly.

But fortunately for Senator Mark Begich (D-AK), the only Republican challenger making clear signals about running is a man who is despised by his state's general electorate, and underwater with members of his own party... Joe Miller.

So what happened to the man who came painstakingly close to becoming Senator just two and a half years ago? What caused the guy who defeated incumbent Lisa Murkowski in a Republican primary to become so disliked within his own party?

A series of ethical and ideological controversies that emerged near the tail-end of his almost-successful 2010 Senate campaign seem to be the catalyst, and his narrow Senate loss and subsequent law-suit to challenge the results did little to stop the bleeding.

Though whatever the cause of the once-rising Conservative stars' fall, the consequences seem pretty clear. Alaskans say they would vote overwhelmingly to reelect Democrat Mark Begich if their second option is Republican Joe Miller.

Not only that, but Alaska REPUBLICANS would just assume have anybody else - any potential Republican candidate - as their nominee in 2014.

The chart below documents every potential Alaska 2014 Senate Republican primary match-up involving Joe Miller from every pollster to test the race thus far (and the pickings are pretty slim; they're limited to just Public Policy Polling and Harper Polling - both partisan firms). But the results are remarkably similar:


In nearly every possible Alaska GOP primary match-up one could imagine, no matter the ideology or number of candidates running against him, Miller winds up as the LAST choice of Alaska conservatives. Meanwhile Gov. Sean Parnell is the most formidable 2014 Alaska Republican in the primary, with Sarah Palin being the second most formidable.

Saturday, May 25, 2013

ABC / Washington Post House Ballot Poll Stands Out In More Ways Than One

Photo courtesy of http://historicalromneys.tumblr.com/

You know a poll finding might be a little screwy when the actual pollster releases the information with an explanation or caveat. And that's exactly what happened on Thursday morning when Gregory Holyk and Gary Langer of Langer research wrote this in explaining the substantial Democratic lead on the 2014 generic House ballot question in ABC/Washington Post's new national survey:

While it’s far too early to handicap the 2014 election in any serious way, registered voters currently favor the Democratic candidate over the Republican in their congressional district by 48-40 percent, the largest Democratic midterm advantage since 2006. The party saw steep losses in the 2010 midterms.

The result almost entirely reflects a current Democratic advantage in partisan affiliation. Among registered voters in this survey, 33 percent identify themselves as Democrats, 22 percent as Republicans; most of the rest are independents, and they split evenly in their 2014 preference. Democrats outnumbered Republicans by 6 points in the 2012 presidential election and by 7 points in 2008, but they were even in the last two midterms – meaning the Democratic advantage holds only if their midterm turnout improves dramatically.
What Mr. Langer is saying here is not that their finding is incorrect (though that is certainly possible), but rather that if it is accurate, it would break precedent. And as I've pointed out on this blog before, he's right. A Democratic partisan identification advantage over Republicans of 11 points is just very, very unlikely in a midterm election. In fact, partisan identification in every midterm election since 1990 has ranged between D+3 and R+1, a fairly tight window of difference.

Moreover, a glance at the 2014 House Ballot polling over the last month shows ABC/WaPo is a bit of an outlier, both in terms of party I.D., and the overall topline result:

Because Rasmussen Reports tracks the generic House ballot question once a week, their findings are listed as a monthly average for the sake of the chart.

As you can see, the average of pollsters shows the Democrats with just a 3 point advantage over Republicans on the generic House ballot, not 8 points, and with a 7 point party I.D. advantage, not 11 points. So not only is the Washington Post poll an outlier in the scheme of historical 2nd-term midterm election results, it's an outlier when compared to recent House ballot polling.

Wednesday, May 22, 2013

Tea Party Revival? Two New Polls Provide Conflicting Results in the Wake of the IRS Scandal

The Tea Party was the runner-up 'Person of the Year' for Time Magazine in 2010. Tea Party members, politicians, and activists are pictured above, from left: Sharron Angle, William Temple, Scott Brown, Sal Russo, Rick Santelli, Glenn Beck, Rand Paul, Jim Demint, Sarah Palin (center), Ron Paul, Dick Armey, Stephen Broden, Michele Bachmann, Christine O'Donnell, & Amy Kremer (far right). Illustration courtesy of Finlay Mackay

Though never known for their immense popularity with the public as a whole, the Tea Party has experienced a ratings-dive since their hey-day before the 2010 midterm election. Fortunately for them, there is some new poll data that indicates the recent IRS scandal may be providing the movement with a sympathy bump in terms of public perception.

In 2010, pollsters found the anti-tax, anti-spending conservative group with an overall 33/34% favorable/unfavorable rating, while roughly the same portion of Americans either had no opinion, or refused to state their opinion. At the same time, 29% said they supported the movement, while 26% opposed it.

Yet since those days when the stock market rose and fell in wild swings in a single day, when the unemployment rate peaked at a 10%, when wages plunged to a 20-year year low, public sentiment soured on the always alluring, yet always divisive grassroots movement.

Following the Republican's 2010 midterm landslide, the Tea Party saw their evenly-divided favorability ratings drop to a decidedly negative 30/43% average. And though polling has been somewhat limited since the 2012 election, they've averaged an even less stellar 32/48% in the 6 months since November. Meanwhile, the margin of those saying they "support" rather than "oppose" the movement dropped 6 points since 2010.

But in two surveys out after news broke on May 10th that the IRS targeted conservative groups, it appears the Tea Party is receiving a bit of a sympathy boost as a result of the perceived slight.

CNN is the first to release poll findings showing the Tea Party with a notable gain in public perception. While a plurality of Americans still say they view the Tea Party unfavorably (45%), that number is down from 48% in CNN's poll two months earlier. The number of Americans viewing the Tea Party favorably has seen an even bigger jump, with 37% now viewing the group favorably, vs. 28% in March. Most of that improvement is seen among Democrats and Independents, not Republicans, oddly enough.

ABC/Washington Post joined the fray yesterday with another survey showing the often demonized Tea Party with a respectable 40/43 favorability rating.

But does polling truly indicate an emerging Tea Party resurgence? 

It depends on which of the two post-IRS scandal pollsters you believe most: CNN or ABC/Washington Post.

If you believe CNN, there is some definite movement in favor of the Tea Party as compared to two months ago. The chart below looks at every CNN survey on the Tea Party's favorability rating since 2011, immediately following their takeover of the House of Representatives:


The Tea Party's favorable/unfavorable rating has improved a net 12 points since March 2013, the best numbers measured by CNN since 2010.

Tuesday, March 12, 2013

Obama Administration's "The Sky Is Falling" Antics Catch Up To The President's Job Approval Rating

Stock Photograph by White House Public Domain
Yesterday, a new McClatchy/Marist survey was accompanied by the following headline: "...Obama Tumbling in voters' eyes." Their conclusion was based on the fact that Barack Obama's job approval rating has fallen to it's lowest point since November of 2011, at 45/48%, while only 34% say the country is on the right track (62% say it's on the wrong track). Their previous survey from early December 2012 had shown the President in positive territory, with 50% of Americans approving of the job he was doing as President, and just 44% disapproving.

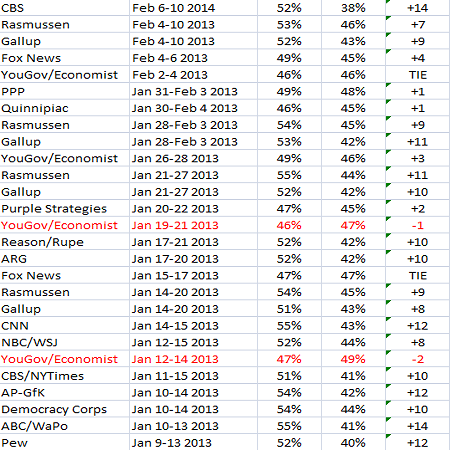
Unfortunately for Obama, the McClatchy/Marist poll is not an anomaly. In fact, the vast majority of pollster's who have examined the President's job approval rating since his reelection have found a decline in his numbers, especially since the sequester took effect just two weeks ago. Consider for example the two daily tracking polls, Gallup and Rasmussen. Before March 1st, the day the budget sequestration officially went into effect, Barack Obama managed an average daily job approval rating of 52/42%, a net +10 points, since his reelection. But an average of Gallup surveys taken after the sequester shows his job rating has fallen to 48/45%, a net decline of 7 points. Meanwhile, the Rasmussen daily tracking survey shows Obama has averaged a 51/48% job approval rating since the sequestration went into effect, compared to a 54/45% job rating from his reelection to March 1st.

The chart below compiles a list of every polling survey on Barack Obama's job approval rating I could find. While poll trackers like Pollster and TPM are helpful, they are often incomplete, excluding various pollsters for particular reasons. The below chart is more complete than any single 1 of the poll trackers, and compiles Barack Obama's average job rating from his reelection last November to today:
**Job approval info courtesy of TPM poll tracker, Huffington Post Pollster, pollingreport.com, and random personal searches.
***Rasmussen and Gallup track the President's approval rating daily. As a result, their numbers in the above chart represent weekly averages.

Tuesday, March 5, 2013

It's Not the End of The World for the GOP: A Comparison of 2010 and 2014 Generic Congressional Ballot Polling


Republicans seem to be doing a lot of head-scratching these days. For most of President Obama's time in office, nothing seems to have gone the way they had predicted or hoped. And worse than that, the GOP is receiving the overwhelming majority of the blame from the American public for the country's seeming state of disarray. From the debt ceiling debate, to the "fiscal cliff," to the sequester and more, President Obama has become the new Teflon president, while the GOP can barely muster a quarter of the country to admit they have a favorable view of the party. But how can all of this be? After all, the Democrats have controlled the Senate chamber for the last 6 years, and the White House the last four.  The President's masterful control of the bully pulpit, his continued nationwide, campaign-style advocacy on behalf of his 2nd term agenda, and an obviously supportive D.C. press corps, all have some role in creating the impression of a Republican Party that just can't get it together. 

And to top it off, in the wake of weak white turnout in 2012, there's talk in some circles of an emerging Democratic majority, at least at the presidential level. Sounds like a bit of a disaster for the GOP, huh? Surprisingly, no, not if the generic congressional ballot for 2014 is any indication.

According to both Pollster Trend and TPM Poll Tracker, Democrats currently lead the 2014 generic congressional ballot by just 42-40% and 43-40%, respectively. Regarding the 3 most recent surveys from 3 pollsters that frequently ask the generic ballot question, Republicans actually LEAD in one of them (Harper Polling (R)), TIE in one (PPP (D)), and trail by 3 in the other (Rasmussen). Should these numbers convince the GOP it's time to the shift their views leftward, or cause panic over a Democratic landslide in 2014? Probably not, especially once you consider where Republicans stood on the generic ballot at this point in the 2010 cycle. The below chart compares the 2010 and 2014 generic ballots by looking at an average through the time line of post-election 2008/2012 through the present (early March 2009/2013):
Compiled from TPM and Pollster

Without question, the Tea Party landslide of 2010 was an electoral high-watermark for Republicans over the last quarter century. That year, Republicans gained 63 House seats, 6 senate seats, controlled 29/50 governor seats, and carried the national house vote 51-45%. Yet despite all their success, at this very point in the 2010 cycle, it was the DEMOCRATS that led the Republicans on the generic ballot, 44-37%, as the above chart indicates. By comparison, present-day Republicans are only trailing Democrats on the generic ballot 45-41%. So, here's a message to Republicans: The SKY IS NOT FALLING...yet, at least. Especially not when you realize that no 2nd-term President's party has gained seats in Congress in their final midterm election since 1938, save 1998.

Monday, March 4, 2013

Rick Perry's Possible 2014 Gubernatorial Bid is D.O.A. per PPP, but University of Texas Says Otherwise

Photo courtesy of Corbis

Texans, according to the Democrats favorite polling firm, can't seem to get rid of 3-term Governor Rick Perry, who has refused to rule out a historical fourth bid for the Governor's mansion in 2014. Though there seems to be some disagreement about whether Texans actually want to give him the boot. Public Policy Polling released a brutal survey for Perry last month that showed both the Texas elctorate as a whole, and the Republican primary electorate, wanting Perry to hang it up.

From the PPP release:

Perry could face great peril in a primary challenge next year. Only 41% of GOP primary voters want him to be their candidate again, compared to 47% who think it's time for someone else. And in a head to head match up with Attorney General Greg Abbott, Perry leads by only a 41/38 margin.

“Most Texas voters are ready to move on from Rick Perry,” said Dean Debnam, President of Public Policy Polling. “They think it’s time for a new Governor."
To hear PPP explain it, Rick Perry, who remains undecided on seeking a fourth term as Governor, should definitely consider retiring. The general Texas electorate and the primary electorate all agree on this fact. And miraculously, Perry, who easily trounced his BIG-NAME opponent Kay Bailey Hutchison four years earlier in the GOP primary, only leads the largely unknown Republican Atty General in a hypothetical primary battle by 3 points, 41-38%. With numbers like that, it would require a certain degree of irrational stubbornness to proceed with what appears to be a losing battle, right?

Fortunately for Team Perry, there are two important data points that dispute the notion that the Governor is D.O.A. for a 2014 bid. 1) A new University of Texas internet poll directly contradicts PPP's January finding, showing Rick Perry quite strong in a GOP primary, at least at this early stage of the race. And 2) PPP has a history of finding a very weak Rick Perry at early stages of past contests, only to see him turn it around in the closing months.

Regarding the UT Poll: Rick Perry leads Attorney General Greg Abbott by a near 3-to-1 margin:

In a 2014 Republican primary for Governor held today, who would get your vote? (Taken Feb. 14 - 24, 2013, among Republican voters)
Rick Perry (R) -  49%
Greg Abbott (R) -  17%
No Opinion -  31%

That's a world of difference from PPP's finding of a statistical tie. And Rick Perry's 49% showing is just barely short of the 50% required by Texas law to avoid a run-off. In 2009, Perry consistently polled in the 30s and lower 40s at this point of the primary campaign (see chart below). If it does come down to Perry v. Abbot next March, Perry is starting in a much better position than he did against Hutchison in 2009.

Beyond the UT poll, however, is the fact that despite Perry's poor showing in the January PPP poll, he can take comfort knowing weak, early PPP findings haven't stopped him before. Outside of an internal poll done on behalf of the Kay Bailey Hutchison (R) campaign, PPP was the ONLY pollster of the 2009-2010 TX Gubernatorial polling cycle to show Hutchison with a lead against Perry as large as 25 points. During that same period of time, other pollsters found Hutchison AND Perry with only narrow leads over the other. The chart below documents all 25 polls released on the 2010 TX primary, taken after the 2008 election: