Friday, December 21, 2012

Rubio leads 2016 field in first outing from Harper Polling (R)


Harper Polling is a new Republican firm designed to be the GOP's answer to the well-known Public Policy Polling (D). Politico recently did a piece on the new group regarding the Democratic edge in the polling and data departments. Well, it seems they're already up and running, as they've released their first numbers regarding the 2016 Republican primary:

Marco Rubio:  34%
Chris Christie:  18%
Condoleeza Rice:  14%
Rand Paul:  8%
Allen West:  5%
Scott Brown:  3%
Undecided:  18%

Rubio leads the pack, confirming the PPP poll from two weeks ago that had Rubio ahead, albeit by a much smaller margin. Though the likely reason for the large disparity is in the candidates that were polled. Harper Polling included a few unconventional candidates in exchange for likely candidates like Paul Ryan, Jeb Bush, or Rick Santorum. PPP only polled likely candidates.

PPP results from 12/6/2012:
Rubio:  18%
Christie:  14%
Bush:  12%
Ryan:  12%
Huckabee:  11%
Rice:  8%
Palin:  7%
Rand Paul: 7%
Santorum: 4%
Other/Undecided:  7%
*Note Rick Santorum is in last place. That's a precarious position for the runner-up to the 2012 GOP nomination, as I wrote about here.

From Harper Polling, regarding the 2016 poll:
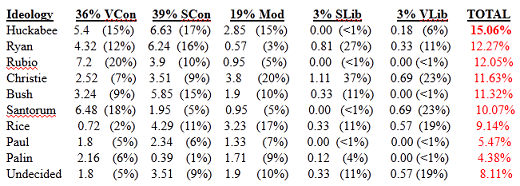
Rubio is strongest in the South and West.  There’s some logic in that.  He’s a son of the South, for those who count Florida as the South.  The Hispanic appeal may run a bit stronger out West.  In the Northeast, he and Christie run virtually tied at 29-27%.  The Midwest may ultimately be the harder nut to crack for Rubio.   His working class background may be his strongest connection to the industrial Midwest.

The Chris Christie primary voter appears to lean more toward the middle.  Along with Condi Rice, his voters are more likely to support exceptions to the no-new-taxes pledge and they believe that compromise is better for the country.  They are less likely to watch Fox News and support TEA party goals.

Speaking of the TEA party.  It is the foundation of Rubio’s support.  Approaching half of all TEA supporters (43%) are voting for him.  If I’m one of the other guys, it can’t stay that way.  Somebody has to eat away at that base for Rubio.

Despite Media focus on Guns, Americans have other ideas for dealing w/ school shootings

 Protestors interrupt NRA president Wayne LaPierre today during a press conference addressing the Newtown, CT shootings. (Credit: Getty)

In the wake of the Newtown, Connecticut massacre, Gallup has some interesting poll findings. Despite a media that has been all-gun control, all-the-time since the tragic December 14th shooting, the American public apparently thinks there are better ways to respond:


Great news for Bay State's recent Senate Loser: Brown poised for comeback


The Mass Inc. Polling Group, a Massachusetts based polling firm, had excellent news today for soon-to-be ex-Senator Scott Brown (MA). Their popular Governor, Deval Patrick, would trail Brown by 7 points in a hypothetical special election Senate race:

Brown (D):  47%
Patrick (R):  40%
Other/Unsure:  13%

The result is miraculous for two reasons: 1. Sen. Brown just lost a protracted, heated battle to Elizabeth Warren by 7 points.  2. Deval Patrick is quite popular in his home state, sporting a 60/26% favorable/unfavorable rating.

For what it's worth, Brown is quite popular in the Bay State himself, with a 58/28% rating, and leads every other possible challenger by as little as 15 points and as much as 27 points. But honestly, how many people would have guessed he'd be leading the popular blue-state Democratic Governor by near double digits in a hypothetical election, especially considering that he only defeated Martha Coakley in 2010 51-47%? Not many. But the survey results look even better for Brown when you take a closer look at the internals.

Monday, December 17, 2012

Paul Ryan vs. Hillary Clinton 2016? Not Even Close, says Purple Strategies Poll


Poll nerds will be thrilled to already see some new 2016 horse race numbers from Purple Strategies. For the record, Purple Strategies fared pretty well in the 2012 election, per the NYTimes Nate Silver. To start off, they've decided to pit failed-VP nominee Paul Ryan against hugely popular Secretary of State, Hillary Clinton, and few will be surprised by the result.

Clinton: 53%
Ryan: 36%
Unsure/Other: 11%

Clinton stomps Ryan by 17 points. Not only that, but she dominates him in nearly every metric. She carries women by 24 pts (57-33%) and men by 9 points, 49-40%. Obama lost "men" to Romney 52-45%. Both Hillary and Ryan are strong with their base. The problem for Ryan, however, is that he's losing big among Independents (53-36%), and his base is outnumbered by Hillary's base by 10 points in this poll. In other words, the Purple Strategies likely voter sample identified as 40% Democrat, 30% Republican, and 29% Independent, or D+10. During the election just 6 weeks ago, voters identified as just 6% more Democratic than Republican. The last Presidential election in which Democrats and Republicans were at near-parity was in 2004, when both parties made up 37% of the electorate.

Presidential election results by congressional district.

Pic of 2008 Presidential election results by district. Courtesy of CQ Politics, 2009.

Cook Political Report editor David Wasserman recently tweeted the following:
Of course, what David is referring to is the "congressional district method" of awarding electoral college votes. Forty-eight of the fifty states award their electoral votes based on the winner of their state at-large. Maine and Nebraska award delegates according to the winner of each individual congressional district, awarding two bonus electoral votes to the statewide popular vote winner.

Wasserman's tweet struck me as intriguing given that Romney lost the national popular vote by a fair margin of 3.7 points. How could this be?

The most obvious answer is gerrymandering, the process by which political parties manipulate geographic congressional boundaries for political gain. But the bizarre result still had me wondering how the gerrymandering process would have effected presidential results throughout history, in the event all 50 states adopted the Maine/Nebraska EV rule.

Below is a chart comparing actual electoral college votes to what the vote would have been had all states adopted the Nebraska/Maine method of apportioning electoral votes:

Thursday, December 13, 2012

Nikki Haley in REAL Trouble in South Carolina Re-election Bid


For a time in 2010, Nikki Haley's star was one of the brightest in the GOP. She was another beautiful, articulate, but most importantly, conservative female rising through the ranks to become her state's top executive. She received early endorsements from party figure-heads like Sarah Palin and Mitt Romney. She won the Republican's gubernatorial primary, avoiding a run-off by just 1% in a crowded field, only to win the run-off 51-35%. South Carolinians appeared to genuinely like Haley, despite her surprisingly close 51-47% finish in the 2010 Governor's race, a year when Republicans made huge gains across the country. But then there were issues involving marriage infidelity, claims that she was too focused on the national spotlight, and most recently, a huge state-wide hacking scandal. A new Public Policy Polling survey confirms the SC public has taken note of her missteps:

Wednesday, December 12, 2012

Hillary Clinton (and Ashley Judd!) shockingly strong in DEEP red Ky., per PPP


Public Policy Polling is out with a new poll in Kentucky that has some pretty interesting findings. You know a poll is good when the biggest news IS NOT that Hollywood actress Ashley Judd (D) trails Libertarian/Tea-Party darling incumbent Sen. Rand Paul (R) by just 1 point (in a state Obama lost last month 61-38%, no less)! No, the biggest news out of this poll is the fact that Sec. of State Hillary Clinton would lead BOTH home-state Sen. Paul and national rising star Marco Rubio, 47-42% and 48-40%, respectively.

The result, according to PPP President Dean Debnam, shows just how competitive Democrats could be for the third presidential election cycle in a row:

Harsh realities for 'Palin 2016' bid


Public Policy Polling is out with a new national survey of voter's opinion regarding a number of potential 2016 presidential contenders. Americans seem to have high regard right now for Gov. Chris Christie, Condoleeza Rice, and Hillary Clinton. Their favorable/unfavorable numbers are 48/26%, 51/29%, and 57/36% respectively. On the other end of the spectrum, Rick Santorum and Sarah Palin clock in with the worst favorability ratings of those tested, at 30/40% and 33/56% respectively.

The -23 point favorability rating for Palin would give pause to anyone considering a run for President, and indeed, may be the reason why she didn't throw her hat in the ring in 2012. Below is a chart of Governor Sarah Palin's national favorability ratings, starting in the months before the historic 2010 GOP take over of Congress (a feat that was largely accredited to Palin's primary-advocacy on behalf of Tea Party candidates across the nation):

Palin's favorable / unfavorable rating since September, 2010

All fav/unfav ratings can be found at argojournal & pollster

As you can see from the chart, an examination of the last two years of Palin's favorable/unfavorable rating indicates she saw her highest popularity around the time of the Tea Party take over of Congress. But even then, her favorability only averaged 38%/51% by the end 2010.  Her ratings took a notable dip across the board early the next year following the tragic Tuscon shooting of Rep. Gabby Giffords, when Palin and the Tea Party movement were called out for blame by the national media (rather unfairly). Her fav/unfav score SINCE the shooting has averaged 31%/57% (a net 13 pt drop from her average prior to Tuscon).  Unfortunately for the former Alaska Governor, Tuscon appears to have been a pivotal moment in her political career. Before then, her mediocre favorability may have been overcome with a concerted, smart public relations push. Since then, negative sentiment regarding Sarah Palin seems to have deepened and become more entrenched.

Fact is, fairly or unfairly, for good or for bad, Sarah Palin is not a well-liked national politician. Sure, she has a strong base of support among Americans who identify as "Republican" (66/25% per the new PPP poll) or "Conservative," (65/24%) but it stops there, rather haltingly. Moderates & Liberals hold an overwhelmingly negative view of Palin (16/74% and 9/80%, respectively). Independents in the PPP survey view Sarah Palin unfavorably by a 51-38% margin, despite disapproving of the job Barack Obama is doing as president by a staggering 22 points (37/59%)! That's a problem for any candidate for high office.

Just to show you HOW big of a problem it is, the below charts examine what it would take for Palin's favorability rating to break even in the PPP survey. How many Republicans or Conservatives would have to exist in the electorate for Palin's favorable rating to exceed her unfavorable rating (something it hasn't done since before 2010)? The PPP poll finds Americans identifying as 29% Liberal, 32% Moderate, and 39% Conservative. The libeal/conservative gap is roughly similar to what exit polls found on election day, 2012, when 25% identified as Liberal, 41% as moderate, and 35% as Conservative, though the 39% Conservative finding by PPP is historically high (NOT high enough for Palin to break even). How high would that conservative number have to be? Very high:

Nate Silver on Hillary Clinton in 2016


Nate Silver is up with a post on why Hillary Clinton would be formidable in 2016, and it's not because her favorability ratings are exceptionally high:

But if Mrs. Clinton runs for president in 2016, one thing is almost certain: she won’t be as popular as she is right now. Recent polls show that about 65 percent of Americans take a favorable view of Mrs. Clinton, while only about 30 percent have a negative one. Those are remarkably high numbers for a politician in an era when many public officials are distrusted or disliked.
But part of the reason for Mrs. Clinton’s high numbers is that, as secretary of state, she has remained largely above the partisan fray that characterizes elections and fights over domestic policy.

The coolest thing  about the Silver article is the chart that compiles information on Hillary's favorable/unfavorable rating since 1992:


Tuesday, December 4, 2012

PPP promotes findings of Republican fringe; glosses over poor job approval for Obama


Public Policy Polling is out with their first post - election take on the American pulse, testing everything from President Obama's job approval rating, to feelings on various political celebrities such as Nate Silver and General David Petraeus. In case you were wondering, Nate Silver's favorability rating is 12% favorable, 10% unfavorable, while 77% are unsure of either who he is or how they feel about him). In a post titled: "Republicans not handling election results well", PPP blogger Tom Jensen fails to make mention of President Obama's abysmally low 37/59% job approval rating with Independents. Not to mention the President's rating with ALL voter's is an unimpressive 50/47%. In fact, it is historically poor when compared to past presidential job approval ratings.

Take, for example, PPP's measure of how Barack Obama was doing at a similar point after his first election (albeit, a little later) in North Carolina: by a 66/25% margin, North Carolinians approved of President elect Obama's transition into office . Granted, the survey questions are different, but they both measured a level of satisfaction/dissatisfaction with Barack Obama shortly after winning a general election. Not only that, but Independent voters gave him a 65/24% approval rating in the days just before his 2009 inauguration, a very far cry from his post-2012 election rating of 37/59%.

North Carolina: Net Change in Obama's margin against GOP, 2008-2012, county-by-county

Net change of 0 - 2% = light pink               Net Change of 0 - 2% = very light blue
                   2.01 - 4% = pink                                          2.01 - 4% = light blue
                   4.01 - 6% = red                                            4.01 - 6% = blue
                   6.01 - 8% = dark red                                    6.01 - 8% = dark blue
                   8.01% + = very dark red                              8.01% + = very dark blue

Above is a county-by-county map of North Carolina, shaded to represent where President Obama experienced his largest net percentage margin gain & losses against his Republican contender from 2008 to 2012. The red counties are the counties where Obama did worse against Romney than he did against McCain. Likewise, the blue counties are the counties where Obama performed STRONGER against Romney than he did against McCain. The lighter the shade of red or blue, the slighter the difference in the net margins between Obama & his opponent from '08 to '12. The darker shades of red or blue represent where Obama/GOP saw their largest gains from 2008 to 2012.

Monday, December 3, 2012

UPDATE #2: Christie vs. Booker, New Jersey Governor's race 2013


Public Policy Pollling (D) became the third pollster in the last week to test a hypothetical Chris Christie (R) vs. Cory Booker (D) 2013 gubernatorial run. On the bright side for Booker, he performs much stronger against Christie in the PPP poll (only trails 50-36%), as opposed to the Rutgers (54-34%) and Quinnipiac (53-35%) poll. On the down side, Booker, a popular Democrat in a blue state, still trails the Republican incumbent by double digits.
     
Similar to the Rutgers and Q-poll, PPP again finds Christie performing exceptionally well with Independents  AND Democrats. In fact, Booker only attracts 57% of Democrats, nearly 30% LESS than the scandal-ridden former New Jersey Governor Jon Corzine (D) did against Christie in 2009. This is almost certainly due to the strong positive marks NJ residents give their Governor on his handling of Hurricane Sandy. But are those strong positive feelings likely to last until election day, 2013?  As I've explored here and here, below is a table showing what the PPP poll would look like had they found Booker attracting 86% of the Democratic vote (the amount Corzine attracted in 2009):

Thursday, November 29, 2012

2013 VA. Gov: With Warner (D) & Bolling (R) out, looks like McAuliffe (D) vs. Cuccinelli (R)


Quinnipiac released a 2013 Virginia Governor's poll on November 14th, showing tight races between the presumed Democratic nominee Terry McAuliffe and his two likely Republican opponents, Bill Bolling and Ken Cuccinelli. Though with Bolling indicating yesterday he would not seek the Republican nomination for Governor (and Mark Warner indicating the same), the race seems all but set between McAuliffe and Cuccinelli. McAuliffe was an unsuccessful candidate in the 2009 Democratic primary for Governor, and lost to Creigh Deeds (D) (50-26%), the man who eventually went on to lose to Gov. McDonnell (R) in the general election, 59-41%. Ken Cuccinelli is the state attorney general who earned the reputation among Democrats as a Republican boogey man by filing suit on behalf of his state against Obamacare. This tweet from NBC's Chuck Todd sums up insiders view of a potential McAuliffe / Cuccinelli match-up:


Wednesday, November 28, 2012

UPDATE: Christie vs. Booker, New Jersey Governor's race 2013

 
Yesterday I proposed that Cory Booker may not want to give up yet on the NJ Governorship in 2013, considering Christie's inflated numbers with Democrats and Independents in the wake of Hurricane Sandy in a new Rutgers-Eagleton poll.

Today, Quinnipiac released their own poll on a hypothetical Booker v. Christie race, and found nearly the exact same result as Rutgers; Christie leads 53-35% (he led 53-34% in the Rutgers poll). Also like the Rutgers poll, Christie is dominating among Republicans and Independents, while siphoning off a fair number of Democrats - 20%, to be exact (26% in the Rutgers poll).

But like last night's post, the results look a bit different in the event Booker is able to do at least as well among Democrats as John Corzine (D) in 2009. The Rutgers poll showing Christie up 53-34% became a 2 point Booker lead (46-44%) if the poll is reweighted to show Booker receiving 86% of the Democratic vote (the percentage obtained by Corzine in '09). Does the same thing happen to the Quinnipiac poll when reweighted to Corzines '09 numbers?:

Tuesday, November 27, 2012

Why Cory Booker may want to give the 2013 NJ Governor's race another glance


As survey after survey pours out of New Jersey confirming Chris Christie (R) as one of the most popular Governors in America, the likelihood of popular Democratic mayor Cory Booker entering the 2013 gubernatorial race has dropped.

Once thought to be somewhat vulnerable to a challenge from a strong Democrat, Chris Christie now leads all of his challengers by at least 19 points, including the much hyped, rising Democratic star,  Cory Booker. A new Rutgers-Eagleton poll of New Jersey, taken Nov 14-17, shows the boisterous New Jersey Governor receiving a 19 point bounce in his personal favorability rating following a mega-storm that left millions throughout the northeast stranded and without power. Just one month earlier, before Sandy struck, and 1 month after his keynote speech at the RNC, Christie was barely above water with New Jersey voters. His favorability rating was an unimpressive 48/42%, and more voters said they'd rather NOT reelect him (47-44%). Seven weeks later, and Christie's favorability rating has surged to 67/25%, representing a net 36 point net increase. Now, Voters DO want to see him reelected, 59-32%, and a recent Fairleigh Dickinson poll shows his job approval rating at  77%.

Monday, November 26, 2012

2012 Youth Vote: Anomaly or permanent Democratic voting bloc?

P

In 2008, election watchers were surprised when voters under age 30 turned out in record breaking numbers to support Barack Obama's first presidential bid (by record breaking margins, as well). But they were down right aghast when Team Obama, despite an abundance of polling data indicating youth enthusiasm was down, managed to increase turnout amongst this historically unreliable voting block. But is this voting block on a consistent rise in the same way white voters have been on a consistent decline? Are 18-29-year-olds a permanent constituency of the Democrats, or does history suggest there's a path for GOP inroads?

18-29 yr-old voting patters, 1976-2012


2016 Democratic primary: Absent Hillary, no clear front-runner in New Hampshire


With the 2016 New Hampshire Democratic primary about 40 months away, Public Policy Polling is out with a survey revealing some interesting (or not so interesting, depending on who is running) top line results. In the event Sec. of State Hillary Clinton chooses to run, she seems poised to win her second NH primary in a row, but by a much larger margin than her 39-37% victory over Barack Obama in 2008. She leads a crowded 2016 field by a WHOPPING 60%, with 2nd place Joe Biden at 10% - amazing considering he is now a two-term Vice President.

"Given the choices of Joe Biden, Hillary Clinton, Andrew Cuomo, Martin O’Malley, Deval Patrick, Brian Schweitzer, Mark Warner, and Elizabeth Warren, who would you most like to see as the Democratic candidate for President in 2016?
  • Hillary Clinton 60%
  • Joe Biden 10%
  • Andrew Cuomo 7%
  • Elizabeth Warren 4%
  • Deval Patrick 3%
  • Martin O'Malley 0%
  • Brian Schweitzer 0%
  • Mark Warner 0%
  • Someone else/Not sure 15%"

Sunday, November 25, 2012

ELECTION 2012: State-by-state changes in party I.D.


While national partisan identification may have shifted 1 point from the 2008 election to the 2012 election, that spread wasn't consistent everywhere. Some states saw larger shifts than others, usually in favor of the Republicans, but certainly not always. Nationally, 38% of voters identified as Democrats (down 1 pt from 2008), 32% identified as Republicans (same as 2008), and 29% identified as Independent (also, same as 2008).

Below is a chart showing the shift in national party ID per state since 2008. Note that some states are missing due to the "National Election Pool's" decision to cut back on exit polling in 2012 as a cost saving measure. As a result, on 31 states featured exit poll results, as opposed to all 50 states in 2008.

Wednesday, November 21, 2012

Rick Santorum's rough road to the 2016 nomination


A new article from the Christian Post reports that an anonymous evangelical leader close to the Santorum team has confided that the 2012 GOP runner-up is taking steps to run in 2016:

"Rick's getting ready [sic] organized and is not going to be behind the eight-ball when it comes to fundraising and building a grassroots organization," the anonymous source said. "I think you'll see and hear a lot from Rick in the next 12 months."

Tuesday, November 20, 2012

The likely make-up of the 2016 Iowa Caucus electorate could determine who runs

The Republican field in 2016 looks wide-open for the moment, according to Public Policy Polling (D). In newly released polls of Iowa, New Hampshire, and Florida,  politicos ranging from Mike Huckabee, to Chris Christie, to Jeb Bush come out at the top of the pack. With the Iowa Caucuses just three years away, lets take a look at some different turnout scenarios based on past exit polling. The information below provides a more detailed look at the Iowa PPP results, extrapolated from their ideological I.D. findings.

PPP results extrapolated from Ideological I.D. findings:
"VCon"= very conservative; "SCon" = somewhat conservative; "Mod" = moderate; "SLib" = somewhat liberal; "VLib" = very liberal


How Exit Polls changed as election night wore on


One interesting feature of the 2012 general election is the fact that historically unreliable EARLY exit poll data actually proved to be more favorable to Romney than Obama, going against the popular notion that early numbers tend to favor Democrats. Several metrics, ranging from Party ID, to views of government, to race/ethnicity showed  more promising numbers for Romney earlier in the night, only to magically change as more and more returns were actually counted.

For example, just two hours before the first polls closed on the East Coast, politico reporter Jamie Dupree tweeted the following:  
"41% say the government should do more - 53% say the government is doing too much; it was flipped 51-43 in 2008"

But by the time the night was over, that 12 point lead for those thinking the government is doing TOO much had dwindled to just an 8 point, 51-43% lead.

Jon Karl of ABC News also provided some flawed preliminary exit poll data. See these tweets from just before 6 pm E.S.T., election night 2012:

"In two ABC prelim exit polls, Romney slightly edges Obama on handling of the economy and the deficit (51-47 and 50-46 percent)"

"In our ABC preliminary exit poll, voters give Obama the edge over Romney on who is more in touch with them (52-44)"
 What were the actual numbers? In the end, Romney's edge over Obama on the economy and deficit was NOT the 4 points early exit data indicated. In fact, it wound up being just 1 point, 49-48%, and just 2 points on the budget deficit (49-47%). Meanwhile, the number who felt the President was more in touch with them than Romney grew from an 8 point deficit to a ten point deficit (53-43% for Obama).

The difference between early, preliminary exit poll data, and the final result was evident in several other places, but perhaps none more consequential than partisan identification. At about 6:05pm, E.S.T., one hour before the first polls closed on the East Coast, CNN provided viewers with (and I tweeted) the preliminary Party ID data:

Monday, November 12, 2012

2016 Not Looking Any Better for Republicans


Days before the polls closed on November 6, 2012, the Obama team was predicting publicly that the electorate would be less white than in 2008, and they were right. Their argument went like this:

"Since the campaign began, Team Obama has assumed that whites would make up 72% of voters, down from 74% in 2008. (The logic: This percentage has decreased in every U.S. election, and the minority population continues to grow.) On the other hand, Republicans counter that due to greater GOP enthusiasm, the white percentage could very well stay the same as in 2008 -- or even be a tick higher. And according to our NBC/WSJ pollsters, the final outcome here could sway the election. If you assume that both sides maximize their margins (Romney wins whites by 20 percentage points and Obama wins minority voters by 60 percentage points), whites making up 75% of the electorate would give Romney the edge with the popular vote by a fraction of a point. But if the white percentage is 74%, Obama would win the popular vote by a fraction of a point. And if it’s 73%, Obama wins by one point. Bottom line: Watch the white percentage in tomorrow night’s exit polls; it will tell you more about where Virginia or Iowa or Colorado or Wisconsin will go." 

Seems awfully prophetic in retrospect.

Further evidence that something has to do be done about the GOP / non-white voter divide


Mitt Romney won a larger percentage of the white vote than George W. Bush in 2004, but that wasn't enough to overcome massive deficits with non-white voters. Perhaps the best example of this lies with the Latino vote. Romney lost the third largest voting block by an astonishing 44 points (71-27%). Compare this to 2004, when Bush ran just 9 points behind John Kerry among a group that made up  8% of the electorate (44-53%). Or compare it to the 2008 Democratic landslide in which McCain lost the Latino vote by 36 points, or 67-31%.

Considering that current tallies have the national popular vote at about 50.6% for Obama, and 47.8% for Romney, how well would Mitt Romney have had to do with Latinos in order to overcome Obama in the national popular vote?

Wednesday, November 7, 2012

A look at 2012 Demographics

Myself and others speculated that if the GOP won white voters by about 20 points or more, that would offset any gains for Democrats from white turnout being held at 2008 levels (when they made up 74% of the electorate). And indeed, Romney performed much better among white voters than John McCain four years earlier, winning the largest voting block 59-39%. McCain only carried the group by 12%.

But what many did not count on (myself included) was a full 2% drop in the number of white voters in the electorate. That, coupled with 2008-like African American turnout, increased Latino turnout, and a stronger Obama margin with Latinos led to Romney's demise.