Showing posts with label Rasmussen. Show all posts

Wednesday, July 8, 2015

The Rise of Non-White Voters: Why The Racial Composition Of National 2016 Election Polls May Be Missing The Mark

Exit polling indicates that the non-white share of the electorate has increased by 2-4% in every presidential election since 1992. Picture courtesy of Jacquelyn Martin/A.P.

The Cook Political Report's Political Analyst David Wasserman recently tweeted the message below, regarding the likely racial make-up of the 2016 presidential election:


Wasserman's tweet revives a point made very shortly following the 2012 election, when I posited that based on demographic shifts since 1992, white voters could expect to make up anywhere between 68-70% of the 2016 electorate.  Why? Because the white share of the presidential vote has dropped between two and four points every cycle since 1992.

Well, the prognosticators at The Cook Political Report have spoken. And given their level of expertise in these matters, I'll happily give them the benefit of the doubt and go with their estimate - the 2016 electorate should be roughly 70% white, and 30% non-white.

Based on Wasserman's analysis, it might be a bit surprising to learn that the racial composition of some pollsters' surveys looks little like his assumption of the 2016 electorate. Democratic firm Public Policy Polling's most recent national survey found likely voters identifying as 74% white, and 26% non-white. If PPP's past success boils down to, what their director Tom Jensen called in 2013 "... a well informed but still not entirely empirical hunch," you have to wonder what less-than-empirical hunch led them to peg the 2016 electorate at 74% white, 26% nonwhite. These figures represent an even LESS racially diverse electorate than the one that showed up in the 2012 presidential election. And as I've already noted, the electorate has become MORE racially diverse in every presidential election since 1992. In other words, for the 2016 electorate to resemble PPP's racial composition, a major reversal of precedent is required.

Friday, May 9, 2014

Democrats May Have A Midterm Turnout Problem In North Carolina, But Not So Much So, Says New Rasmussen Poll

Photo courtesy of Scott McIntyre.

The release of Rasmussen's first post North Carolina Senate GOP primary survey reminded me of Nate Cohn's New York Times article from last week, titled 'Why The Democrats Turnout Problem Is Worst In North Carolina.' The piece provided some useful information pertaining to North Carolina voting demographics from the 2010 midterm election, especially considering the fact that no exit poll was conducted in the state that year.

For example, per Cohn, the white percentage of the 2010 North Carolina midterm electorate was six points whiter than in 2012 (77% vs. 71%, respectively). The black vote was three points lower than in 2012 (20% vs. 23%), while the '65 years & older' age group was 6 points higher (26% vs. 20%). Naturally, this is all good news for Republicans, as they typically perform stronger with white voters than minorities, and older voters vs younger.

In light of the information provided in the New York Times piece, lets consider how the Rasmussen survey results would have differed applying 2010-like race and age statistics.

Tillis leads Hagan overall in the survey 45-44%. Among white voters only, his lead grows to 26 points, or 57-31%. For what it's worth, that's a good deal less impressive than Romney's 68-31% advantage over Obama in 2012, when he carried the state overall by two points. Rasmussen also finds that white voters make up 72% of the NC electorate, vs. 77% in 2010. Those numbers are more in line with 2012 style turnout than 2010. So what would Rasmussen have found if survey respondents had been more illustrative of 2010 racial identification (all other findings remaining the same)?


What was a virtual tie between Tillis and Hagan becomes...welll...less of a tie. The Republican's lead is still within the four point margin of error, but he does add a bit more distance between himself and the incumbent.

A similar occurrence is seen when applying 2010-age identification to the Rasmussen survey. Tillis leads among the oldest of voters, 62-35% (while younger voters spring for Hagan, 46-29%). Rasmussen found just 20% of North Carolina likely voters identifying as being over the age of sixty-five years old, though they made up 26% of the electorate in 2010. How would the Rasmussen results have looked with a larger pool of older voters?


Again, not a significant shift, but definite movement in Tillis's direction. The bottom line is that, if you buy Rasmussen's numbers, Tillis is starting the general election against Hagan with an advantage regardless of which electorate - presidential or midterm - shows up.

Tuesday, March 18, 2014

Recent Surveys Show Scott Brown Falling Well Short Of Markers Set By Romney, Ayotte In New Hampshire

Photos from left to right courtesy of Just Jared, Gretyl Macalaster, and Marc Nozell. Apologies for not being able to resist the gratuitous shirtless Scott Brown pic.
 
Given recent stories of New Hampshire GOP weariness regarding the now announced Scott Brown Senate bid, it's hard to believe there was a time when the pick-up truck driving, common-man type was a source of great Republican pride. After all, how could the establishment, or the Tea Party for that matter, begrudge the man who wrestled away the Senate seat held by liberal lion Ted Kennedy for five decades, in a state with a partisan bent like Massachusetts?

But a stinging, if not anticipated loss to Elizabeth Warren and the Democratic presidential turnout machine in 2012, on top of less than inspiring polling numbers against his new Democratic opponent Jeanne Shaheen, have caused the former model/attorney to lose a bit of his luster. Most recent surveys of the 2014 Senate battle find Brown trailing Senator Shaheen by around 10-pts or more. However, he's got three other headaches to contend with beyond the simple fact he's losing.

First of all, his polling trend lines do not look good. After a strong month in January (when he trailed Shaheen by an average of 44-40% across four surveys), Brown now trails by an average 50-39% (in four surveys taken since February). He's also lost ground among various demographic and political groups. Consider the chart below:

Polling used in the average can be found at Huffington Post's Pollster.

Brown went from leading among New Hampshire voters aged 18-45 years old by three points in January, to trailing with this group by eleven points in February/March. He held Shaheen to an eleven point advantage among women in January, though her advantage has now doubled to twenty-two points. Brown's lead among men dropped, while Shaheen's lead with >46 year olds and Independents grew slightly. The only positive trend for Brown from January to February/March was his numbers among Republicans, which improved from January ever-so-slightly.

The second headache for Brown? Not only is he trailing Shaheen, but he's WELL behind where his would-be Senate colleague, Kelly Ayotte (R) was polling at this point in 2010, and is failing to hit crucial markers reached by Mitt Romney in 2012. Granted, Brown has nearly impossibly large shoes to fill if he hopes to recreate Ayotte's landslide 60-37% victory over Paul Hodes (D) during the last Republican wave. But for the record, she was leading Hodes by double-digits before the Spring of 2010. Brown hasn't led a poll against Shaheen yet, at least not according to the Huffington Post or Real Clear Politics.

Thursday, October 31, 2013

Six Polls In Two Days: Cuccinelli Is Definitely Losing, But Pollsters Disagree On Whether He's Closing Or Fading

By far his highest profile campaign surrogate, Hillary Clinton's widespread popularity may indeed help McAuliffe to put it away next week. And more than a few DC journalists have reported that the McAuliffe '13 campaign serves the dual purpose of being a test run Hillary's old inner circle. A.P. photo.

For anyone trying to get a handle on the state of the Virginia Governor's race with just a week to go, today was not the best day to tune in. No less than SIX polling firms have released new numbers since Tuesday, all without a lot in common. Though one overiding theme is present in all of them: Ken Cuccinelli is losing.

In fact, McAuliffe has led his opponent in the last 32 consecutive polls. But agreement on who is winning is where the similarities stop. Consider the small table below, which groups all five recent surveys into one chart:


The Democrat leads by anywhere from a 4-pt to 15-pt spread, with McAuliffe ranging between 42-51% of the vote, Cuccinelli 33-41%, and Sarvis 8-12%.

So take your pick, right?

The problem for Republicans, however, is no matter how you mix and match those polling numbers, there just isn't a winning scenario for Ken Cuccinelli. McAuliffe's worst performance (42% in the Hampton poll) is still better than Cuccinelli's best (41% in the Quinnipiac poll).

Digressing back to the recent poll variation; the trajectory of the race is hard to decipher not simply because of the topline result, but because of divergent trendlines as well. The Washington Post and Roanoke College polls seem to think the ground is crumbling beneath the Republican nominee. In mid-September, McAuliffe led Cuccinelli 47-39%. That lead grew to 51-39% five weeks later. Roanoke found a similar trend, though to a greater extent. Just 3 weeks ago, the local Virginia pollster found the Democrat up against the Republican and Libertarian, 41-36-9%. He's now at 48-33-10%.

Monday, June 10, 2013

A Rising Tide Lifts All Boats: Will Obama's Improved Standing in Massachusetts Carry Ed Markey Over the Finish Line?

Obama''s campaign visit wasn't enough to lift Martha Coakley in 2010, perhaps because his job approval was low, even for a state as Democratic as Massachusetts. But the President will be in a much better position when he campaigns for Ed Markey Wednesday. Photo on left courtesty of Michael Dwyer/AP/Corbis, photo on right found here.

With the Massachusetts special senate race just over two weeks away, pollsters are providing us with a mini-avalanche of new data, a great deal of which appears conflicting at times. But one thing the pollsters seem to agree on this go 'round is the level of Massachusetts approval for the job President Barack Obama is doing in Washington D.C.

Despite having endured what many would refer to as the worst month of his Presidency (it started with the Benghazi whistleblower in early May, then moved to the IRS scandal, then the James Rosen Fox News Reporter dust-up, then the A.P. phone records scandal, followed by the NSA whistleblower, culminating in today's State Department scandal), Massachusetts still largely approves of the job he's doing. Obama manages an average 57% job approval rating in what is arguably America's bluest state. Just 39% of Bay-Staters disapprove of the job he is doing. See the chart below:

Several polling firms did not test Obama's job approval/disapproval rating.

With only one exception (the UMass/YouGov poll), Obama's net job approval rating is relatively high, certainly compared to his national average. It ranges from +31 in the first Suffolk survey, to a low of +1 in the YouGov poll. Compare that, however, to his job approval/disapproval rating in the 3 weeks before the 2010 special election between Scott Brown and Martha Coakley:

Only pre-election polls that surveyed Obama's job approval/disapproval rating are included in the above chart. Data compiled from Real Clear Politics and Huffington Post Pollster.

2010 "likely voters" were much more down on the job the President was doing then than they are now. His average rating is a net 10 points lower than it was in Massachusetts three years ago. His spread ranged from +1 to +16, though Rasmussen was the only pollster to show Obama's net approval rating as high as double digits. The rest found it in the low single digits.

Tuesday, March 19, 2013

2016: Paul Ryan More Unpopular than Sarah Palin, John Edwards, and Joe Lieberman Were At This Point

2004 Vice Presidential nominee John Edwards (D) (left) actually had a much better net favorability rating at this point in time following the 2004 election than either 2012 nominee Paul Ryan (R), or 2008 nominee Sarah Palin (R).
GOP budget-guy, numbers-hunk, and one-time promising candidate for President in 2012 and 2016 got smacked with some upsetting "numbers" himself this week when Rasmussen Reports released their latest national survey on likely voter impressions of the would-be Vice President: 

Do you have a favorable or unfavorable opinion of Paul Ryan? (nat'l survey of 1,000 likely voters conducted March 14-15, 2013)
Favorable:    35%   (-8)*
Unfavorable:   54%   (+8)
*Number in parentheses represent the percent-change in Ryan's favorable/unfavorable rating among likely voters nationwide since Rasmussen's previous poll on the race in January.

Only a little more than 1 in 3 likely voters view the young Wisconsin Congressman favorably, while a solid majority see him unfavorably. To be blunt, those are really awful numbers. We're talking Nancy Pelosi, Sarah Palin type numbers. But they're even worse in the context of where he once stood on Rasmussen Reports, as recently as just two and seven months ago:


Over the course of just two months, views of Paul Ryan have gone from being split evenly among the electorate, to tilting overwhelmingly unfavorable...at least, according to Rasmussen Reports. Where did his massive 16 point negative downturn since January come from? Ryan fell across the board, but most notably among Republicans. In fact, his drop among Republicans is so stark that you almost have to chalk it up to statistical error. For example, a whopping 40% of his own party views him unfavorably, with just 52% seeing him favorably. Compare that to his January Rasmussen rating, when his fav/unfav rating was a staggeringly high 76/14% among Republicans.

Even outside of Rasmussen Reports, you can detect a distinct downward trajectory since the election last November in Paul Ryan's favorability ratings. Perhaps his 'front-and-center' role in the nation's budget debate is to blame. Or perhaps it's due to the Democratic-created notion that Paul Ryan wants to end Medicare as we know it. Or perhaps it's simply his association with a failed presidential campaign. Either way, his post election favorability ratings have been worse than each of the 3 preceeding Vice Presidential losers before him, at a similar point in time following their election loss; the 3 VP nominees being Sarah Palin (R), John Edwards (D), and Joe Lieberman (D). The chart below averages the findings of every favorability survey on the four former VP nominees, from the time of their selection, until present day (or the equivalent thereof in 2009, 2005, and 2001). The full list of each nominee's favorable/unfavorable ratings can be found here, and was compiled from Pollster, TPM Poll tracker, Poll Report, and National Journal.


While all four of the most recent failed Vice Presidential candidates maintained overall positive favorability ratings from the time of their selection to this point in their post-VP run, Paul Ryan's rating remains the lowest, at just 41/40%. Consider the fact that both Joe Lieberman AND John Edwards (pre-love-child scandal, of course) maintained personal favorable ratings of +20 or more (44/15% and 46/26%, respectively). In short, Joe Lieberman was the most popular VP nominee of the last 4 elections, while Paul Ryan is the least (based on favorability ratings from the time of their selection to this point in their post-VP runs).

Tuesday, March 12, 2013

Obama Administration's "The Sky Is Falling" Antics Catch Up To The President's Job Approval Rating

Stock Photograph by White House Public Domain
Yesterday, a new McClatchy/Marist survey was accompanied by the following headline: "...Obama Tumbling in voters' eyes." Their conclusion was based on the fact that Barack Obama's job approval rating has fallen to it's lowest point since November of 2011, at 45/48%, while only 34% say the country is on the right track (62% say it's on the wrong track). Their previous survey from early December 2012 had shown the President in positive territory, with 50% of Americans approving of the job he was doing as President, and just 44% disapproving.

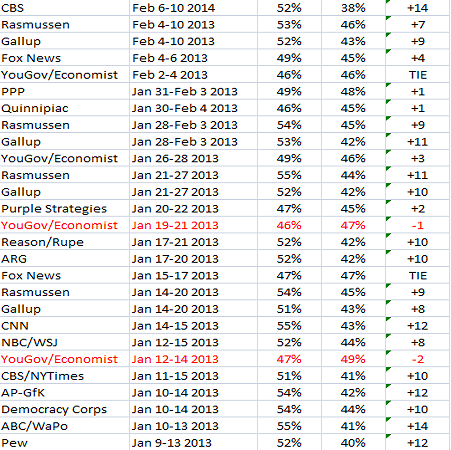
Unfortunately for Obama, the McClatchy/Marist poll is not an anomaly. In fact, the vast majority of pollster's who have examined the President's job approval rating since his reelection have found a decline in his numbers, especially since the sequester took effect just two weeks ago. Consider for example the two daily tracking polls, Gallup and Rasmussen. Before March 1st, the day the budget sequestration officially went into effect, Barack Obama managed an average daily job approval rating of 52/42%, a net +10 points, since his reelection. But an average of Gallup surveys taken after the sequester shows his job rating has fallen to 48/45%, a net decline of 7 points. Meanwhile, the Rasmussen daily tracking survey shows Obama has averaged a 51/48% job approval rating since the sequestration went into effect, compared to a 54/45% job rating from his reelection to March 1st.

The chart below compiles a list of every polling survey on Barack Obama's job approval rating I could find. While poll trackers like Pollster and TPM are helpful, they are often incomplete, excluding various pollsters for particular reasons. The below chart is more complete than any single 1 of the poll trackers, and compiles Barack Obama's average job rating from his reelection last November to today:
**Job approval info courtesy of TPM poll tracker, Huffington Post Pollster, pollingreport.com, and random personal searches.
***Rasmussen and Gallup track the President's approval rating daily. As a result, their numbers in the above chart represent weekly averages.

Tuesday, March 5, 2013

It's Not the End of The World for the GOP: A Comparison of 2010 and 2014 Generic Congressional Ballot Polling


Republicans seem to be doing a lot of head-scratching these days. For most of President Obama's time in office, nothing seems to have gone the way they had predicted or hoped. And worse than that, the GOP is receiving the overwhelming majority of the blame from the American public for the country's seeming state of disarray. From the debt ceiling debate, to the "fiscal cliff," to the sequester and more, President Obama has become the new Teflon president, while the GOP can barely muster a quarter of the country to admit they have a favorable view of the party. But how can all of this be? After all, the Democrats have controlled the Senate chamber for the last 6 years, and the White House the last four.  The President's masterful control of the bully pulpit, his continued nationwide, campaign-style advocacy on behalf of his 2nd term agenda, and an obviously supportive D.C. press corps, all have some role in creating the impression of a Republican Party that just can't get it together. 

And to top it off, in the wake of weak white turnout in 2012, there's talk in some circles of an emerging Democratic majority, at least at the presidential level. Sounds like a bit of a disaster for the GOP, huh? Surprisingly, no, not if the generic congressional ballot for 2014 is any indication.

According to both Pollster Trend and TPM Poll Tracker, Democrats currently lead the 2014 generic congressional ballot by just 42-40% and 43-40%, respectively. Regarding the 3 most recent surveys from 3 pollsters that frequently ask the generic ballot question, Republicans actually LEAD in one of them (Harper Polling (R)), TIE in one (PPP (D)), and trail by 3 in the other (Rasmussen). Should these numbers convince the GOP it's time to the shift their views leftward, or cause panic over a Democratic landslide in 2014? Probably not, especially once you consider where Republicans stood on the generic ballot at this point in the 2010 cycle. The below chart compares the 2010 and 2014 generic ballots by looking at an average through the time line of post-election 2008/2012 through the present (early March 2009/2013):
Compiled from TPM and Pollster

Without question, the Tea Party landslide of 2010 was an electoral high-watermark for Republicans over the last quarter century. That year, Republicans gained 63 House seats, 6 senate seats, controlled 29/50 governor seats, and carried the national house vote 51-45%. Yet despite all their success, at this very point in the 2010 cycle, it was the DEMOCRATS that led the Republicans on the generic ballot, 44-37%, as the above chart indicates. By comparison, present-day Republicans are only trailing Democrats on the generic ballot 45-41%. So, here's a message to Republicans: The SKY IS NOT FALLING...yet, at least. Especially not when you realize that no 2nd-term President's party has gained seats in Congress in their final midterm election since 1938, save 1998.