Showing posts with label exit poll. Show all posts

Friday, November 7, 2014

Did ex-Senator Udall's 'War On Women' Strategy Depress the Female Vote in Colorado?

 
Photo Courtesy of the NRSC


It's an interesting coincidence that female turnout, as a percentage share of the electorate, was the lowest nationwide in Colorado Tuesday night. Couldn't possibly have anything to do with the sharply negative ads in the state, largely directed at women, could it?

Nearly two years ago, Colorado's incumbent Democratic Senator was considered safe in a midterm election that would seemingly favor Republicans. Then came the backroom deal that propelled Cory Gardner to the nomination. Knowing that Gardner was their greatest political threat of the Colorado GOP bench, the Udall campaign began a focused effort on convincing Colorado women that the Republican nominee for Senate would eliminate their access to abortions and birth control. After the Obama/Biden campaign experienced some success with the so-called "war on women' tactic in 2012, Udall hoped to replicate their campaigns impressive performance among females by singing a similar tune.

This time, however, they were unsuccessful. Gardner has been declared the winner with 93% of precincts reporting.

Over time, Udall's single-issue focus on women's reproductive health drew criticism and ridicule from all political corners, most notably from local Colorado newspapers that historically bent Democratic. And indeed, Tuesday night's exit polling would indicate Udall's 'war on women' strategy failed. Though the Democrat did ultimately win the female vote, it was by a rather unimpressive 52-44%, especially when compared to Udall's seventeen point loss among Colorado males, or Beauprez's twelve point loss with women, or Buck's seventeen point loss with females in 2010.

But there appears to be another interesting side effect of the "war on women" overkill seen in the 2014 Colorado Senate race - women made up a lower proportion of the electorate as compared to men than in ANY other Governor or Senate contest that night, save only the Colorado Governor race.
Just 47% of Colorado voters identified as female, while 53% identified as male. For reference, the national exit poll taken Tuesday found women made up 51% of voters, with men at 49%. Even Alaska, where men outnumber women in the total population, found higher turnout among women in their Senate race (48%) than Colorado. Of the forty-one exit-polled contests on November 4th, women outnumbered men as a share of the electorate in thirty-two of them, or 78% of the time. Men outnumbered women in only four of them, or just 10% of the time. The five remaining contests split 50/50 between male and female voters.

Friday, August 9, 2013

Michelle Nunn Looks Strong In Early Georgia Senate Polling, But Beware of Undecided Romney Voters

State Legislator Jim Martin nearly rode Obama's coattails into office in 2008, holding Sen. Saxby Chambliss to just 49% of the vote. He subsequently lost the Dec 2, 2008 run-off, despite the support of hip-hop artists T.I., Young Jeezy, & Ludacris. No Democrat has won a statewide race for President, Senate, or Governor in Georgia since 2000. Photo courtesy of Getty Images.

If anyone familiar with recent presidential electoral history said they weren't a little surprised by the 2008 election results in Georgia, they're probably bluffing.

The only Deep South  state in the last 5 presidential elections to see a Democrat come within 5 points of a Republican would hardly be recognizable to the Georgia that re-elected George W. Bush by 17 points just eight and a half years ago.

Yet four years later, the McCain-Palin ticket earned a worryingly low 52% of the vote, while Obama-Biden nabbed 47%, the highest percentage for a Democrat in the Deep South since Bill Clinton's 52% Louisiana victory in 1996.

And again in 2012, the year that Republicans were supposed to take back the White House after four years of a sluggish economy, Romney's margin over Obama was much closer than GOP strategists would have liked (slightly less than 8 points), and far from an '04-like landslide. 

Though for all their recent success at the presidential level, Georgia Democrats remain in pretty rough shape statewide.

 In 12 statewide elections for President, Governor, or Senate since 2000, Democrats have won ONE (and that was in 2000).

But fortunately for likely 2014 Democratic Senate nominee Michelle Nunn, her father and former 24 year U.S. Senator Sam Nunn is one of the few Georgia Democrats that still carries any sort of considerable bipartisan clout, boasting a 50% favorable rating with Democrats, a 58% rating with Republicans, and 64% with Independents. And if recent PPP poll results are any indication, his daughter is making good use of his political capital.

Of the seven total candidates tested against Nunn in a hypothetical 2014 Senate race, the Democrat leads or ties ALL of them, earning between 40-42% of the total vote. Her Republican opponents garner between 35-41%.

So, you can see why Georgia Democrats might find reason to rejoice in the wake of PPP's latest release. With the sole exception of the 2008 Senate contest between Saxby Chambliss and Jim Martin (pre-run-off, and in a wave year), Democrats really haven't come close to beating Republicans in statewide elections for 13 years.

So why were a few pundits quick to dismiss PPP's results on Wednesday?

2014 just happens to fall during Obama's second term, which historically speaking, has been VERY harsh to the incumbent President's party.

But more than that, as Real Clear Politics Senior Elections Analyst Sean Trende noted on Twitter, most of the undecided voters in the PPP poll are likely to lean to the GOP Senate candidate.

Consider the chart below, which highlights the percentage of poll respondents who said they were "not sure" regarding their 2014 Senate vote, broken down by 2012 presidential vote, party I.D., and ideological I.D.:


Monday, May 6, 2013

Massachusetts Senate: Gabriel Gomez (R) exhibiting similar demographic strengths to Scott Brown 2010

Massachusetts Republican Senate nominee Gabriel Gomez campaigns in Shrewsbury, MA in February, prior to his 15 point primary win last Tuesday. Photo courtesy of AP/Winslow Townson
Last week long-time Democratic Congressman Ed Markey successfully defeated his pro-life, Obamacare opposing primary challenger Stephen Lynch 57-43%, while on the Republican side, newcomer ex-Navy SEAL Gabriel Gomez defeated opponents Mike Sullivan and Dan Winslow 51-36-13%.

Fortuanately for Republicans, early polling on the race had indicated that of all the possible match-ups for the special election, a Gomez vs. Markey battle would be the most competitive. Gomez (R) performed better than Sullivan or Winslow in all pre-primary polling against Markey OR Lynch, while Lynch performed stronger against all 3 potential GOP opponents than Markey. So in terms of all the different potential match-ups, the Republicans lucked out, as a new Public Policy Polling (D) survey confirms:

The candidate for US Senate are Republican Gabriel Gomez and Democrat Ed Markey. If the election was today, who would you vote for?

Ed Markey  (D)  -  44%
Gabriel Gomez  (R)  -  40%
Undecided  -  16%

Prior to his primary win, Gomez had trailed Markey by 15 and 19 points. Since his win, two polls have shown the race within at least 6 points, WNEU and now, PPP.

In the special election three years ago, loser Martha Coakley (D) never relinquished her lead over eventual winner Scott Brown (R) until about 2 weeks before the actual election. This year's election is still 6 weeks away. So obviously, things look pretty good at the moment for Gabriel Gomez. He's starting ahead of where Scott Brown was in polling at this point in 2010, and has ample time to move ahead of Markey (or perhaps, move further behind).

The two most recent, non-presidential-electorates in Massachusetts took place in 2010. Scott Brown defeated Martha Coakley (D) 52-47% that January, while Gov. Deval Patrick (D) won reelection against Charlie Baker (R) and Tim Cahill (Independent) 48-42-8%.

How does the 2013 special election electorate compare to the one that catapulted Brown to victory in January 2010, and the one that helped Patrick survive for a 2nd term that November? They're similar in some, but not all ways.

For example, consider the racial identification PPP gound in the 2013 Senate poll:

Information compiled from 2010 Brown v. Coakley exit polling, 2010 Patrick v. Baker v. Cahill exit polling, and 2006 exit polling.

Tuesday, April 30, 2013

Hurricane Sandy's Other Legacy: Did Late-Deciders Throw The 2012 Election To Obama?

President-elect George H.W. Bush greets the man he defeated by 8 points 1 month prior at his home in Dec. 1988. According to exit polls, Dukakis was just coming alive in the final days of the campaign. He defeated Bush among the 15% of voters that made up their mind in the final week by an impressive 55-43% margin. Photo courtesy of The Atlantic.

Yesterday morning,  Chris Christie took to MSNBC's 'Morning Joe'  to praise the President for his handling of storm aide since Hurricane Sandy made landfall in New Jersey on October 29th. In response to a question from host Joe Scarborough, Christie replied:

 "Listen, the President's kept every promise that he made. And the fact is that...that's what I was saying at the time. What I was saying at the time is I was asked about how was the President doing and I said 'he's doing a good job. He's kept his word.' And so, everybody knows that I have about 95% level of disagreement with Barack Obama on issues of principle and philosophy. But, the fact is, we have a job to do. And what people expect from people they elect is to do their job. And that's why they hate Washington so much..."

Nevermind the context of the comment. The bolded section is what received the blaring Drudge Report headline. And if anything gets remembered from this MSNBC segment during primary season 3 years from now, it won't be Christie's eloquent defense of his actions in the days following Hurricane Sandy. It will be the continued praise of a President loathed by Christie's base.

But putting aside how Republicans feel about whether or not Chris Christie actually cost Mitt Romney the Presidency in 2012, a much more basic question needs answering: did Hurricane Sandy flip the election to Barack Obama? Because if it didn't, Republicans can blame Christie for providing comfort to the enemy at most, but NOT for costing them the presidency.

The simple answer to to the above question is no; Hurricane Sandy did NOT flip the election to President Obama, at least not if you believe the exit polling. And as a result, no, Chris Christie did not cost the GOP the election in 2012. Consider the chart below:

2004-present info compiled from CNN and Roper Center. 1976-2000 info compiled from Best & Krueger's Exit Polls. 1984 exit polls did not include a question regarding the timing of respondents vote decision.

Obama apparently won among voters that decided BEFORE the final few days of the campaign by a margin of 51-47%. But among the 9% of Americans who said they made up their mind in the final few days of the campaign, Obama's margin over Romney was even greater (50-44%).

Thursday, April 25, 2013

Midterm vs. Presidential Demographics: GOP can't count on 2010 turnout in 2014


Reid photo courtesy of A.P.

Throughout the 2012 Presidential election, the likely racial make-up of voters who would make an appearance at the polls on election night was a source of intense debate among pollsters and the media.

Republicans hypothesized the Obama camp would be unable to replicate the record-breaking minority turnout they generated four years earlier, when Obama became the first Democratic President since Jimmy Carter in 1976 to win a majority of the popular vote (and by a much larger margin than Jimmy). Democrats believed their GOTV operation was top-notch and superior to Team Romney's; besides, white voters as a percentage of the electorate had dropped in every presidential election since 1992, while minority voters have been on the rise.

In the end, Republicans were right on one thing, but dead-wrong on everything else. Obama indeed failed to match his 2008 near-landslide defeat of John McCain with Mitt Romney...but he won anyway, and Republicans lost the demographic-debate battle. Not only did minority voters match their turnout numbers from four years earlier, they exceeded it.

Even worse for the GOP, a near-impossible to deny trend in presidential demographics was further confirmed last November- namely, that whites have dropped as a percentage of the electorate in every presidential election since 1992, while non-white voters have increased.

Fortunately for Republicans, the next election will not be a presidential one. 

But does the news really get better for the GOP just by virtue of the fact that the upcoming election is a midterm? What, if anything, do these presidential trends tell us about what we can expect one year and a half from now?

Well, if midterm demographics follow the same pattern presidential demographics followed in 2012, they tell us a good bit.

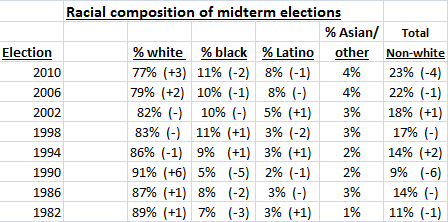
The chart below compiles racial turnout numbers for every midterm election since 1982:

Number in parentheses represents the % change from the preceding presidential election. Information courtesy of Best and Krueger's Exit Polls; Surveying the American Electorate, 1972-2010.

Several pieces of data from the chart stand out.

Saturday, April 13, 2013

Kentucky DEMs catch a break with Ashley Judd out, but is McConnell as vulnerable as it seems?

Minority Leader McConnell (left) and a strong potential Senate opponent, Sec. of State Alison Lundergan Grimes (right). The Grimes photo is from a 2011 campaign ad & is  courtesy of the Grimes campaign. The McConnell photo is courtesy of Alex Wong/Getty Images.
Democrats made clear early on that Senate Minority Leader Mitch McConnell would be on their very small list of top pick-up opportunities in the 2014 midterm elections.  Since then, much of the media focus in terms of McConnell's likely opponent centered on Hollywood actress Ashley Judd, a Democratic activist who grew up in the Bluegrass State with her famous country-duo Mom and Sister, Wynonna and Naomi Judd.

But Democrats caught a break two weeks ago when Judd announced, after a rough exploratory phase, she would not be challenging McConnell.

Though she started out somewhat competitive in polling (she trailed Junior Kentucky Senator Rand Paul 47-46% and McConnell 47-43% in a December PPP poll, and trailed 49-40% in a February Harper Polling survey), a brutal media barrage took its toll on Judd's image. First, there was the fact that though she would be seeking a Senate seat in Kentucky, she actually lives in Tennessee, and has for the last several years. Then came her bizarre affinity for comparing everything to rape - at first it was coal mining, then this bomb dropped: "I've been raped twice, so I think I can handle Mitch McConnell."  Just a day after the story surrounding the latest rape comment surfaced, Judd announced she wouldn't challenge McConnell.

And if the latest Public Policy Polling survey is to be believed, it was a wise decision on Judd's part. Her favorability rating with Kentucky voters dropped 13 points in just 4 months, from +6 in December, to -7 (34/41%) in April. When matched in a hypothetical 2016 Senate race with Rand Paul, she now trails 51-40%.

While it's questionable whether Judd would have been successful in a Democratic Primary, the McConnell campaign almost certainly would rather have faced her than their new potential opponent, KY Secretary of State Alison Lundergan Grimes.

Grimes is a youthful (just 35 years old!), attractive, and most importantly, Kentucky native up-and-comer who was catapulted into her current (and first) elected position in a 2011 special election...yet she trails the Senate Minority Leader just 45-41%.

So where does her impressive performance against McConnell stem from in the internals? In terms of partisan identification, not so much from Independents. They're backing the 5-term incumbent by a slight plurality, 41-39%. And while she attracts 61% from her own party, she's not terribly appealing to Republicans, getting just 16% of their support.

Meanwhile, Mitch McConnell is actually quite strong among Kentucky Democrats, attracting 24% of their vote, the same amount he won in his last reelection bid (for comparison, Rand Paul won 16% of Democrats in his 2010 Senate race against Jack Conway). He's also considerably stronger among his base, picking up 74% of Republicans.

If McConnell is winning Republicans by more than his opponent is winning Democrats, and if he's attracting more crossover support from Democrats than Grimes from Republicans, and if he's leading slightly among Independents, how is this just a 4 point race? It most definitely has something to do with the fact that PPP finds 51% of respondents identifying as Democrats, but just 39% identifying as Republicans, a D+12 partisan advantage. Kentucky voters  may indeed be identifying as such today, but the chart below indicates it would be a Kentucky election first if D+12 holds until November 2014, especially for a non-presidential election year contest:

No Exit polling was conducted in Kentucky in 2012, 2011, and 2007.

As you can see, in every Kentucky election over the last 10 years in which exit polling was conducted, Democrats have outnumbered Republicans a maximum of 9% (and that was in the near-landslide Democratic presidential year of 2008). The Republican's strongest performance in partisan identification came just 2.5 years ago, during the Tea Party take-over of Congress.

Thursday, April 11, 2013

The Predictive Power of Presidential Job Approval on Election Outcomes, according to 1978-2012 Exit Polling

Presidential Job Approval based on exit polling, 1978-2012
It's been posited by some that a president's job approval rating is a pretty decent predictor of eventual election outcomes. But study's that have looked at this before tend to base their findings on pre-election political surveys on who says they will vote, rather than exit poll data that surveys actual voters.

A look at what exit polls have reported on past presidential job approval shows that while attitudes towards the President's job performance are occasionally on-the-mark with regards to the national popular vote, they're not always. For example, voters are frequently willing to vote AGAINST a President or his party's nominee whose job performance they APPROVE of.

More than that, exit poll findings regarding a president's job approval are far more predictive of actual results when an incumbent is seeking re-election, as opposed to the incumbent party's nominee seeking election.

Job performance also tends to be less prognosticative of actual results in midterm elections, as opposed to Presidential, while the President's APPROVAL rating is more likely to reflect his proportion of the vote than his DISAPPROVAL rating is to reflect his opponent's vote share.
The chart below documents the President's job approval rating in every presidential and midterm election since 1978. From 2004-2012, exit poll data from CNN is relied upon. From 1978-2002, exit poll data is provided by Samuel J. Best and Brian S. Krueger's Exit Polls, Surveying the American Electorate, 1972-2010, with the exception of 1988 data, which was retrieved here. Unfortunately, exit pollsters did not ask voters their opinion regarding presidential job approval in 1980, 1984, 1992, and 1996. Thus, in 4 of the 18 elections examined in the chart below, the President's job approval rating is based on the final Gallup Poll taken prior to that election, not exit poll data.

* indicates the President's job approval rating for this year is based on Gallup's final pre-election poll. All other findings come from exit poll results. Red indicates a Republican election victory, blue indicates a Democratic election victory. "H" means "House." "S" means "Senate." House and Senate votes tallies are provided by USHouse.gov

As the chart indicates, excluding midterm elections, voters have frequently voted against Presidents they approve of. A solid 54% majority approved of the job President Barack Obama was doing as they headed to the polls on Nov 6, 2012, but the President only won 51.0% of the vote.

Saturday, March 30, 2013

Shorter Quinnipiac poll: If Ken Cuccinelli is too partisan or extreme for Virginia, someone forgot to tell the voters.

Courtesy of Greg Skidmore
Virginia Attorney General Ken Cuccinelli has been on the receiving end of attacks from the right and left regarding his viability as a 2013 gubernatorial candidate. Democrats think he's a dangerous ideologue who will place purity to the conservative cause above the well-being of citizens of the Commonwealth. Some Republicans, especially Jennifer Rubin of the Washington Post, think he's a weak candidate who is running a low-key at best, inept at worst campaign.

But if the somewhat limited polling on the 2013 Virginia Governor's race to date is any indication, Virginia voters are either unaware that the man they call the "Cooch" is a brash ideologue headed for certain defeat, or are willing to support him regardless.

Take for example the recent Quinnipiac University poll on the 2013 Virginia Governor's race. Cuccinelli leads Terry McAuliffe 40-38%, his first lead in any Quinnipiac poll of the race to date. But the better news for Cuccinelli lies in the trend lines. In Quinnipiac's first survey of the race in November of last year, McAuliffe (D) led Cuccinelli by four points. In the follow-up poll from January, his lead had dropped to 1 point. In February, the two were TIED, and last week, Cooch grabbed his first lead. He also leads McAuliffe among Independents by 37-29%, and sports a +6% overall favorability rating with all Virginia voters (34/20%), though a large plurality don't yet have an opinion on their attorney general (46%). McAuliffe is at +4%, with a whopping 63% who are unsure.

By only 5 points, Virginians say Terry McAuliffe has the right kind of experience to be Governor, while voters say the same of Cuccinelli by 20 points.  And despite all the talk of Ken being an ideologue, a slight plurality of voters say his ideology is "about right," while just 29% say he is "too conservative." For what it's worth, that's the same percentage that say McAuliffe is "too liberal."
Even more so, Virginians approve of the job their attorney general is doing by a large margin, 45/27%. Pretty impressive for a conservative firebrand in a blueish-purple state.  His job approval rating has a higher net margin than that of newly elected Democratic Senator Tim Kaine (47/33%), and only slightly behind Sen. Mark Warner (D) (56/26%), and Gov. Bob McDonnell (53/26%) . That high job approval rating, if it stays there throughout the campaign, could translate into vital support this November.

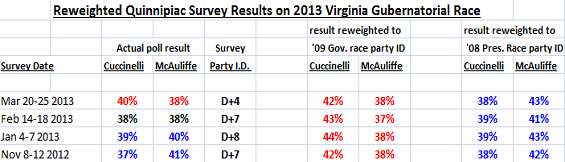
The Cuccinelli camp can find further reassurance in the Quinnipiac cross-tabs on partisan identification. Survey respondents identified as 30% Democrat, 26% Republican, and 35% independent, a good deal less Republican than partisan self-identification in the 2009 Governor's race (37% Republican, 33% Democrat, 30% Independent). Had the Quinnipiac survey found party I.D. to be the same as November 2009, all other findings remaining the same, Cuccinelli would take a larger 42-38% lead.

The chart below compares actual Quinnipiac findings to reweighted partisan identifications: the 2009 Governor's race and the 2012 presidential race. This should provide us with a sort of partisan I.D. floor and ceiling, as Republicans are unlikely to see better than R+4 turnout in November, and Democrats are unlikely to see better than D+7 (party ID in VA. in the last presidential election):


Obviously, if the November 2013 Virginia electorate resembles 2009's electorate, Ken Cuccinelli will likely have a good election night. But if it looks anything like it it did in the presidential election last November, the former head of the Democratic National Committee will likely be Governor.

Which electorate are we likely to see? It's hard to say, but it's probably smarter to compare the upcoming gubernatorial electorate to the last gubernatorial race, given that Obama won't be on the ticket when voters head to the polls in 7 months.

...One final note regarding Cuccinelli's current standing in polls against McAuliffe: he's not doing that much worse than Bob McDonnell at this approximate stage in the 2009 Governor's race. And he went on to win his race by a landslide. The chart below compiles every poll taken on the 2013 Governor's race to date, courtesy of TPM poll tracker, Pollster, and Real Clear Politics:

Wednesday, March 27, 2013

Hillary Tops 70% With Moderates Against Home-Stater Marco Rubio In Recent Florida Poll

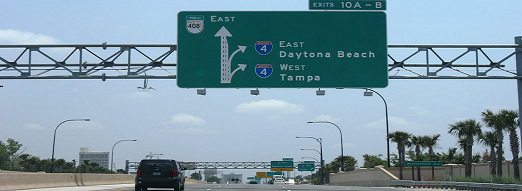
The I-4 Corridor, which runs West-to-East across the Florida peninsula, connecting Orlando and Tampa, is one of the most sought after swing-regions within a "swing-state" in the country.

As I wrote yesterday, Public Policy Polling has a new 2016 poll on the perennial swing-state of Florida. But their swing-state status won't look all that "perennial" if Hillary Clinton has anything to say about it. She leads 3 likely 2016 GOP contenders, former VP nominee Paul Ryan (54-41%), ex-Gov. Jeb Bush (53-40%), and Sen. Marco Rubio (56-40%), demolishing them among Independent AND Moderate voters.

Yes, Hillary Clinton leads two reasonably popular HOME-STATE politicians...by double digits...in a state that hasn't seen a presidential candidate win by such a margin since 1988 (and even then, it was a Republican that accomplished the feat).

If PPP's results are actually borne out, Hillary would far outpace her husband's 48-42% victory over Bob Dole in 1996, the highest winning margin of any Democrat in Florida since exit polling became easily available in 1976. She would make Obama's back-to-back 50-49% & 51-48% wins in 2012 & 2008 look like the work of a political amateur. Her margin over the 3 Republicans in Florida looks the most similar to Ronald Reagan's performance in the state in 1980 (which he captured from Jimmy Carter, 56-39%).
To better understand the significance of a potential double-digit Florida win for Hillary, consider the chart below of Florida presidential election results since 1976:

* Unfortunately the Roper Center has a pay-wall in place to access their state-by-state exit polling. CNN and other networks only provide state-level exit polling back to 2004, and select numbers from 1992 & 1996. Thus, the incomplete data re: the moderate vote in Florida through the years.

Where exactly does Hillary's peculiar strength in such a quintessential swing-state stem from? The PPP cross tabs have her winning around 85% of self-identified "liberal voters," pretty close to Obama's numbers in the state against Romney last November. She manages about 20% of the "conservative" vote, also similar to Obama's 2012 margin.

Nothing in particular stands out until you glance at the vote break-down of "moderates." Hillary doesn't just beat the GOP. She wipes the floor with them:
  • She's +47% with moderates in a hypo against Paul Ryan (69-22).
  • She's +30% with moderates in a hypo against Jeb Bush (61-31).
  • She's +48% with moderates in a hypo against Marco Rubio (71-23).

Monday, March 25, 2013

Moderate voters skew HEAVILY Democratic in PPP's 2016 polling

Map of 2012/2008 election results among MODERATE voters only. Exit polling was only conducted in 32 states in 2012. In the 18 states where there was no survey, 2008 exit poll results were used. Red = Republican, Blue = Democrat, Green = TIE

I consider myself to be pretty moderate on a number of policy issues, mostly social: abortion, immigration, gay marriage, the death penalty, separation of church and state. But if I were asked by an exit pollster my "ideology" on a scale of very conservative, somewhat conservative, moderate, liberal, or very liberal, I'd probably put myself in the somewhat conservative side of things. My views on taxation and the role of government in the economy shove me to the right. But there's a significant portion of the country that identifies their political ideology as "moderate" (41% to be exact). Who are these so-called "moderate voters" that typically make up the plurality of the presidential electorate, and how do they vote? Even more importantly, how will they vote in 2016?

If early Public Policy Polling surveys on 2016 are any indicator, Republicans will be STOMPED by Democrats among "moderates." In fact, the GOP is poised to win the LEAST amount of so-called "moderate voters" ever (or at least since exit polling began in 1976), especially if Hillary Clinton is their nominee. The chart below documents the moderate vote for Hillary Clinton vs. any GOP opponent in every national or state 2016 poll conducted by PPP over the last month. Unfortunately, the very few polling firms besides PPP that have already started surveying the 2016 race did not provide crosstabs for ideological breakdown. So the focus will be on PPP's results:


If you operate under the assumption that Conservatives vote Republican, Liberals vote Democrat, and Moderates split their vote, you'd be wrong, according to PPP...dead wrong. Hillary Clinton leads Paul Ryan, Chris Christie, Marco Rubio, Jeb Bush, Rick Santorum, Bobby Jindal, Newt Gingrich, and Scott Walker among moderates in every state & nat'l poll over the last month, by MASSIVE margins. In fact, the best that any Republican is able to do against Hillary among moderates is Paul Ryan's 57-32% deficit in the state of Pennsylvania. But even then, Hillary leads by 25 points. The WORST any Republican does with moderates is Marco Rubio in Michigan AND his home-state of Florida. Hillary leads him with moderate voters in both states, 65-16% and 71-23% respectively. That's border-line embarrassing for Rubio. To make it worse, Hillary has averaged a 63-25% lead over Republicans with moderates in PPP polling over the last month.

Thursday, February 28, 2013

Republican Primary Electorate Moves Right, Democrats Stationary (a look at primary exit polling, 1996-2012)

The 2000 primary battle between Bush & McCain featured a notably less conservative primary electorate than in 2012. The Gore/Bradley primary electorate was similar to 2008.  Images courtesy of Corbis.

Since the birth of the Tea Party Movement in the aftermath of the election of Barack Obama in 2009, the American public has been subjected to claims by the media that the Republican party of today is more Conservative than the GOP of the 1980s and 90's, or even that of George W. Bush. But is that actually the case? Yes, at least based on the way Republican primary voters have viewed their own ideologies since 1996.

Sure, there have been studies indicating CONGRESSIONAL Republicans have become more Conservative, but have the rank and file followed their lead? A close examination of GOP primary exit polling from 1996-2012 indicates they have. In the 20 states where exit polling was conducted in 2012, Republican primary voters were split exactly into thirds between identifying as "very conservative," "somewhat conservative," or "moderate/liberal." To be exact, 34% of Republican primary voters identified their own political ideologies as "very conservative." That number ranged from a nationwide high of 49% in the Louisiana and Nevada primary contests, to a low of just 15% in Massachusetts (no surprise there). Meanwhile, 33% of Republican primary voters nationwide identified as "somewhat conservative", while the remaining 33% identified as "moderate or liberal." The "moderate/liberal" voters' largest share of the Republican electorate came in the Vermont primary (where they made up 53% of voters), Massachusetts primary (where they made up 49%), and New Hampshire primary (where they made up 47%). Conversely, moderate/liberals saw their smallest shares of the GOP electorate in Iowa (17%), Nevada (17%), and Louisiana (23%).

So there you have it: the ideological identity of Republican primary voters NATIONWIDE in 2012 was 34% very conservative, 33% somewhat conservative, and 33% moderate/liberal (based on the findings of the network's 20-individual-state exit polls). On its face, nothing sounds terribly conservative about that breakdown. Republicans are, after all, the national conservative party. So 67% of the national primary electorate identifying as at least somewhat conservative should probably be expected. But when you compare that split to the three previous Republican primaries in 2008, 2000, and 1996, you see the Republican primary electorate has become considerably less moderate or liberal, and considerably more conservative. See the chart below:
To see the math on how I compiled the above figures from exit polling, see this dataset


Thursday, January 10, 2013

2013 Virginia Governor: PPP paints bleak picture for the Cooch (R). Quinnipiac? Not so bleak.

From left, Cuccinelli, Gov. McDonnell, & Lt. Gov. Bolling after their win in 2009. Oddly enough, the man on McDonnell's left has said he would not be on a ticket with the man on McDonnell's right.

Public Policy Polling released their first poll on the 2013 Virginia Governor's race yesterday, and the results weren't great for likely Republican nominee, Ken Cuccinelli. The former Attorney General only  managed to garner 41% against his probable opponent, failed 2009 Democratic candidate and Clinton-confidant, Terry McAuliffe (who managed 46% in the PPP poll). This result closely mirrors a Quinnipiac poll from November that showed McAuliffe up 41-37%.

Diving into the poll internals, the news only seems to get worse for Cuccinelli. For an example, take a look at the ideological identification of the poll respondents. Virginia voters identify as 27% Liberal, 32% Moderate, and 41% Conservative. Compare this to the exit polls for the 2009 Virginia Governor's race, which saw just 17% Liberal turnout, 42% Moderate, and 40% Conservative. Despite Liberal turnout being much lower in 2009 than the 2013 PPP finding, Cuccinelli would still trail McAuliffe by the same margin if the PPP poll were reweighted to 2009 ideological turnout. See the math in the chart below:


PPP survey weighted to 2009 VA Gov ideological I.D.


How, exactly, is it that Cuccinelli (R) still trails McAuliffe (D) 46-41%, despite reweighting the numbers to a LESS liberal ideological make-up? Because regardless of the drop-off in liberals, moderates were a much larger percentage of the 2009 electorate than what PPP found in their poll. And unfortunately for Cuccinelli, the Republican trails the Democrat among moderates by a substantial, 61-25% margin. That was NOT the case in the 2009 gubernatorial race between Gov. McDonnell (R) and Creigh Deeds (D), when the Democrat carried moderates by a much narrower 53-47% margin. That difference in the performance of Cuccinelli and McDonnell among moderates is the main reason the Republican does just as poorly whether the numbers are weighted to the PPP ideological finding, or the 2009 ideological finding. IF, somehow, the Cooch were able to get 47% of the Moderate vote (as McDonnell did in '09), HE would lead the PPP poll, 51-42%, a 14 pt reversal from the actual PPP result.

Still, the PPP poll is rough for the Virginia Republican. Even IF Cuccinelli were lucky enough to see low liberal turnout like 2009, he'd trail in the PPP poll 46-41%. But it's worth noting that while the PPP ideological I.D. finding is more liberal than the 2009 VA electorate, the 2012 electorate was much LESS conservative. Conservatives made up 41% of the respondents in the PPP poll, 40% of actual 2009 voters, but just 31% of actual 2012 voters. If PPP is right, and 2013 turnout sees low conservative turnout like 2012, Terry McAuliffe (D) has the potential to win big:

Friday, December 21, 2012

Great news for Bay State's recent Senate Loser: Brown poised for comeback


The Mass Inc. Polling Group, a Massachusetts based polling firm, had excellent news today for soon-to-be ex-Senator Scott Brown (MA). Their popular Governor, Deval Patrick, would trail Brown by 7 points in a hypothetical special election Senate race:

Brown (D):  47%
Patrick (R):  40%
Other/Unsure:  13%

The result is miraculous for two reasons: 1. Sen. Brown just lost a protracted, heated battle to Elizabeth Warren by 7 points.  2. Deval Patrick is quite popular in his home state, sporting a 60/26% favorable/unfavorable rating.

For what it's worth, Brown is quite popular in the Bay State himself, with a 58/28% rating, and leads every other possible challenger by as little as 15 points and as much as 27 points. But honestly, how many people would have guessed he'd be leading the popular blue-state Democratic Governor by near double digits in a hypothetical election, especially considering that he only defeated Martha Coakley in 2010 51-47%? Not many. But the survey results look even better for Brown when you take a closer look at the internals.

Thursday, December 13, 2012

Nikki Haley in REAL Trouble in South Carolina Re-election Bid


For a time in 2010, Nikki Haley's star was one of the brightest in the GOP. She was another beautiful, articulate, but most importantly, conservative female rising through the ranks to become her state's top executive. She received early endorsements from party figure-heads like Sarah Palin and Mitt Romney. She won the Republican's gubernatorial primary, avoiding a run-off by just 1% in a crowded field, only to win the run-off 51-35%. South Carolinians appeared to genuinely like Haley, despite her surprisingly close 51-47% finish in the 2010 Governor's race, a year when Republicans made huge gains across the country. But then there were issues involving marriage infidelity, claims that she was too focused on the national spotlight, and most recently, a huge state-wide hacking scandal. A new Public Policy Polling survey confirms the SC public has taken note of her missteps:

Wednesday, December 12, 2012

Hillary Clinton (and Ashley Judd!) shockingly strong in DEEP red Ky., per PPP


Public Policy Polling is out with a new poll in Kentucky that has some pretty interesting findings. You know a poll is good when the biggest news IS NOT that Hollywood actress Ashley Judd (D) trails Libertarian/Tea-Party darling incumbent Sen. Rand Paul (R) by just 1 point (in a state Obama lost last month 61-38%, no less)! No, the biggest news out of this poll is the fact that Sec. of State Hillary Clinton would lead BOTH home-state Sen. Paul and national rising star Marco Rubio, 47-42% and 48-40%, respectively.

The result, according to PPP President Dean Debnam, shows just how competitive Democrats could be for the third presidential election cycle in a row:

Tuesday, November 27, 2012

Why Cory Booker may want to give the 2013 NJ Governor's race another glance


As survey after survey pours out of New Jersey confirming Chris Christie (R) as one of the most popular Governors in America, the likelihood of popular Democratic mayor Cory Booker entering the 2013 gubernatorial race has dropped.

Once thought to be somewhat vulnerable to a challenge from a strong Democrat, Chris Christie now leads all of his challengers by at least 19 points, including the much hyped, rising Democratic star,  Cory Booker. A new Rutgers-Eagleton poll of New Jersey, taken Nov 14-17, shows the boisterous New Jersey Governor receiving a 19 point bounce in his personal favorability rating following a mega-storm that left millions throughout the northeast stranded and without power. Just one month earlier, before Sandy struck, and 1 month after his keynote speech at the RNC, Christie was barely above water with New Jersey voters. His favorability rating was an unimpressive 48/42%, and more voters said they'd rather NOT reelect him (47-44%). Seven weeks later, and Christie's favorability rating has surged to 67/25%, representing a net 36 point net increase. Now, Voters DO want to see him reelected, 59-32%, and a recent Fairleigh Dickinson poll shows his job approval rating at  77%.

Monday, November 26, 2012

2012 Youth Vote: Anomaly or permanent Democratic voting bloc?

P

In 2008, election watchers were surprised when voters under age 30 turned out in record breaking numbers to support Barack Obama's first presidential bid (by record breaking margins, as well). But they were down right aghast when Team Obama, despite an abundance of polling data indicating youth enthusiasm was down, managed to increase turnout amongst this historically unreliable voting block. But is this voting block on a consistent rise in the same way white voters have been on a consistent decline? Are 18-29-year-olds a permanent constituency of the Democrats, or does history suggest there's a path for GOP inroads?

18-29 yr-old voting patters, 1976-2012


Sunday, November 25, 2012

ELECTION 2012: State-by-state changes in party I.D.


While national partisan identification may have shifted 1 point from the 2008 election to the 2012 election, that spread wasn't consistent everywhere. Some states saw larger shifts than others, usually in favor of the Republicans, but certainly not always. Nationally, 38% of voters identified as Democrats (down 1 pt from 2008), 32% identified as Republicans (same as 2008), and 29% identified as Independent (also, same as 2008).

Below is a chart showing the shift in national party ID per state since 2008. Note that some states are missing due to the "National Election Pool's" decision to cut back on exit polling in 2012 as a cost saving measure. As a result, on 31 states featured exit poll results, as opposed to all 50 states in 2008.

Tuesday, November 20, 2012

The likely make-up of the 2016 Iowa Caucus electorate could determine who runs

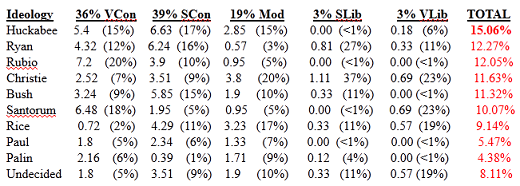
The Republican field in 2016 looks wide-open for the moment, according to Public Policy Polling (D). In newly released polls of Iowa, New Hampshire, and Florida,  politicos ranging from Mike Huckabee, to Chris Christie, to Jeb Bush come out at the top of the pack. With the Iowa Caucuses just three years away, lets take a look at some different turnout scenarios based on past exit polling. The information below provides a more detailed look at the Iowa PPP results, extrapolated from their ideological I.D. findings.

PPP results extrapolated from Ideological I.D. findings:
"VCon"= very conservative; "SCon" = somewhat conservative; "Mod" = moderate; "SLib" = somewhat liberal; "VLib" = very liberal


How Exit Polls changed as election night wore on


One interesting feature of the 2012 general election is the fact that historically unreliable EARLY exit poll data actually proved to be more favorable to Romney than Obama, going against the popular notion that early numbers tend to favor Democrats. Several metrics, ranging from Party ID, to views of government, to race/ethnicity showed  more promising numbers for Romney earlier in the night, only to magically change as more and more returns were actually counted.

For example, just two hours before the first polls closed on the East Coast, politico reporter Jamie Dupree tweeted the following:  
"41% say the government should do more - 53% say the government is doing too much; it was flipped 51-43 in 2008"

But by the time the night was over, that 12 point lead for those thinking the government is doing TOO much had dwindled to just an 8 point, 51-43% lead.

Jon Karl of ABC News also provided some flawed preliminary exit poll data. See these tweets from just before 6 pm E.S.T., election night 2012:

"In two ABC prelim exit polls, Romney slightly edges Obama on handling of the economy and the deficit (51-47 and 50-46 percent)"

"In our ABC preliminary exit poll, voters give Obama the edge over Romney on who is more in touch with them (52-44)"
 What were the actual numbers? In the end, Romney's edge over Obama on the economy and deficit was NOT the 4 points early exit data indicated. In fact, it wound up being just 1 point, 49-48%, and just 2 points on the budget deficit (49-47%). Meanwhile, the number who felt the President was more in touch with them than Romney grew from an 8 point deficit to a ten point deficit (53-43% for Obama).

The difference between early, preliminary exit poll data, and the final result was evident in several other places, but perhaps none more consequential than partisan identification. At about 6:05pm, E.S.T., one hour before the first polls closed on the East Coast, CNN provided viewers with (and I tweeted) the preliminary Party ID data: