Showing posts with label demographics. Show all posts

Wednesday, July 8, 2015

The Rise of Non-White Voters: Why The Racial Composition Of National 2016 Election Polls May Be Missing The Mark

Exit polling indicates that the non-white share of the electorate has increased by 2-4% in every presidential election since 1992. Picture courtesy of Jacquelyn Martin/A.P.

The Cook Political Report's Political Analyst David Wasserman recently tweeted the message below, regarding the likely racial make-up of the 2016 presidential election:


Wasserman's tweet revives a point made very shortly following the 2012 election, when I posited that based on demographic shifts since 1992, white voters could expect to make up anywhere between 68-70% of the 2016 electorate.  Why? Because the white share of the presidential vote has dropped between two and four points every cycle since 1992.

Well, the prognosticators at The Cook Political Report have spoken. And given their level of expertise in these matters, I'll happily give them the benefit of the doubt and go with their estimate - the 2016 electorate should be roughly 70% white, and 30% non-white.

Based on Wasserman's analysis, it might be a bit surprising to learn that the racial composition of some pollsters' surveys looks little like his assumption of the 2016 electorate. Democratic firm Public Policy Polling's most recent national survey found likely voters identifying as 74% white, and 26% non-white. If PPP's past success boils down to, what their director Tom Jensen called in 2013 "... a well informed but still not entirely empirical hunch," you have to wonder what less-than-empirical hunch led them to peg the 2016 electorate at 74% white, 26% nonwhite. These figures represent an even LESS racially diverse electorate than the one that showed up in the 2012 presidential election. And as I've already noted, the electorate has become MORE racially diverse in every presidential election since 1992. In other words, for the 2016 electorate to resemble PPP's racial composition, a major reversal of precedent is required.

Thursday, January 30, 2014

Republicans TIE Hillary Clinton In Latest 2016 Poll, Though Demographics Point To Friendly GOP Electoral Landscape

The topsy-turvy nature of 2012 GOP primary polling looks to be repeating itself in the 2016 cycle. Seemingly out of nowhere, former Governor Mike Huckabee has deposed Chris Christie as the Republican leader to take on Hillary Clinton.

There's good and bad news for both Democrats and Republicans in the new 2016 national survey from the pollster liberals love and conservatives love to hate, the occasionally accurate and always trolling Public Policy Polling.

The bad news for Republicans is their previous standard-bearer, Chris Christie, continues to take a beating in the polls for the "bridgegate" scandal. The New Jersey Governor was a fairly rare political figure for this day and age where everyone seems to hate anyone and anything associated with politics and Washington D.C. He had a double-digit positive favorability rating that stretched across party lines. But over the course of just one month, Christie's favorability rating dropped from the best of the field (43/31%) to THE worst (31/46%; even lightning rod Tea Partier Ted Cruz manages a -10% net rating). Having previously led Hillary Clinton by 3-pts (45-42%), Christie now trails by 2-pts (45-43%).

What's more, the entire Republican field looks pretty unpopular nationally. The most popular potential GOP candidate, Mike Huckabee, could only manage a 37% favorability rating. And even then, his unfavorable rating was slightly higher at 38%. The rest of the field ranges from a net favorability rating of -6% (Paul Ryan) to -15% (Chris Christie).

The good news, however, is that despite all of this, every Republican tested looks like they could be competitive in a national race against Hillary Clinton in 2016. All of them except Ted Cruz poll within the margin of error of Hillary (3.4%). And Christie, the GOP's most unpopular candidate at the moment, leads Joe Biden and Elizabeth Warren by significant margins.

The bad news for Democrats is that like the Republicans, their standard bearer has also fallen in the court of public opinion. Hillary Clinton's favorability entered negative territory for the first time in a PPP survey in years. And potential primary competitors Sen. Elizabeth Warren and Vice President Joe Biden look particularly weak.

The good news for Democrats isn't readily obvious on the face of the poll. But they can find a little relief by pulling back the curtains and examining the crosstabs, for PPP is finding a much more friendly GOP climate than existed in either the 2012 or 2008 presidential elections. In fact, at least two of their more significant demographic findings (race and age) much more closely resemble the 2010 midterm electorate, when Republicans picked up a nearly unprecedented number of House seats and carried the popular vote handily.

Consider PPP's race findings, in which 3/4 of poll respondents identify as white, the highest amount since the 2004 presidential election. We know from examining every presidential election since 1992 that the white share of the vote has dropped from 4% to 2% per cycle. If that tradition holds in 2016, we could expect the white share of the total electorate to be between 68-70% (it was 72% in 2012). For comparison, CNN exit polls showed that white voters made up 77% of the vote in the 2010 midterm election. Likewise, Hispanic voters have seen their share of the electorate increase in every presidential election since 1992 (between 3% and 1% per cycle). In 2012, they made up 10% of voters. By that standard, you'd expect Hispanics to make up between 11-13% of a 2016 presidential electorate, and not the 9% found by PPP (which is much more similar to the 8% found by exit polls in 2010). The African American and Asian share of the vote hasn't increased in ALL of the presidential cycles, but has been on a general upward trend of late.

So I'd posit that the 75 / 12 / 9 / 4% white/black/Hispanic/Asian-Other finding from PPP's national survey is less reflective of a likely 2016 presidential electorate than, say, a 69 / 13 / 12 / 6% finding. Had this been PPP's racial identification finding, Hillary Clinton's narrow margins over her Republican competitors naturally grows (as Democrats have historically performed stronger with minority than white voters). The chart below documents what the PPP results would have been had they found the more racially diverse electorate described above, all other findings remaining the same:


Monday, May 6, 2013

Massachusetts Senate: Gabriel Gomez (R) exhibiting similar demographic strengths to Scott Brown 2010

Massachusetts Republican Senate nominee Gabriel Gomez campaigns in Shrewsbury, MA in February, prior to his 15 point primary win last Tuesday. Photo courtesy of AP/Winslow Townson
Last week long-time Democratic Congressman Ed Markey successfully defeated his pro-life, Obamacare opposing primary challenger Stephen Lynch 57-43%, while on the Republican side, newcomer ex-Navy SEAL Gabriel Gomez defeated opponents Mike Sullivan and Dan Winslow 51-36-13%.

Fortuanately for Republicans, early polling on the race had indicated that of all the possible match-ups for the special election, a Gomez vs. Markey battle would be the most competitive. Gomez (R) performed better than Sullivan or Winslow in all pre-primary polling against Markey OR Lynch, while Lynch performed stronger against all 3 potential GOP opponents than Markey. So in terms of all the different potential match-ups, the Republicans lucked out, as a new Public Policy Polling (D) survey confirms:

The candidate for US Senate are Republican Gabriel Gomez and Democrat Ed Markey. If the election was today, who would you vote for?

Ed Markey  (D)  -  44%
Gabriel Gomez  (R)  -  40%
Undecided  -  16%

Prior to his primary win, Gomez had trailed Markey by 15 and 19 points. Since his win, two polls have shown the race within at least 6 points, WNEU and now, PPP.

In the special election three years ago, loser Martha Coakley (D) never relinquished her lead over eventual winner Scott Brown (R) until about 2 weeks before the actual election. This year's election is still 6 weeks away. So obviously, things look pretty good at the moment for Gabriel Gomez. He's starting ahead of where Scott Brown was in polling at this point in 2010, and has ample time to move ahead of Markey (or perhaps, move further behind).

The two most recent, non-presidential-electorates in Massachusetts took place in 2010. Scott Brown defeated Martha Coakley (D) 52-47% that January, while Gov. Deval Patrick (D) won reelection against Charlie Baker (R) and Tim Cahill (Independent) 48-42-8%.

How does the 2013 special election electorate compare to the one that catapulted Brown to victory in January 2010, and the one that helped Patrick survive for a 2nd term that November? They're similar in some, but not all ways.

For example, consider the racial identification PPP gound in the 2013 Senate poll:

Information compiled from 2010 Brown v. Coakley exit polling, 2010 Patrick v. Baker v. Cahill exit polling, and 2006 exit polling.

Wednesday, May 1, 2013

Fun With Nate Silver's New Interactive Map: Democrats' many paths to 270 in 2016

President George W. Bush held Democrat John Kerry to just 53% of the Latino vote in 2004. But even if Republicans replicate Bush's performance in 2016, they'd have to maintain their 2012 margins with white voters to win.

In the 2012 election, Democrats captured a historical 72% of the Hispanic vote, leading many pundits to speculate that Republicans could have a difficult time capturing the White House in 2016...or perhaps, ever again.

In light of the emerging debate surrounding the effect of immigration reform on Presidential election results, FiveThirtyEight's Nate Silver released an awesome interactive map yesterday that allows users to tamper with various demographic and voting distrubition scenarios to produce certain election results WELL into the future (2048, to be exact). And based on what I've seen from the map, it's pretty difficult to create a plausible scenario where the GOP would win in 2016, much less 2048.

Off the bat, I'll note what Nate Silver pointed out in his article yesterday: "Population growth and changes in voting patterns will have much larger effects than how unauthorized immigrants are treated."

In other words, playing around with the percentage of immigrants that could hypothetically become citizens as a result of immigration reform, as well as the percentage of immigrants that could wind up actually voting, effects the results VERY, very little. I'm talking fractions of a point (which kind of blows a hole in Politico's heavily debunked analysis from last week that immigration reform could create an electoral bonanza for Democrats.)

As a result, I let most of Nate Silver's assumptions remain (which were all derived from a 2012 election baseline), tampering only with white, black, and Hispanic demographic vote distribution.

SCENARIO #1:
The first scenario below shows the GOP winning the 2016 presidential election by a narrow 286-252 electoral college votes, and an even narrower 49.6 - 48.6% popular vote win. But getting to this result requires some pretty optimistic assumptions for the GOP. The Democrats share of the white vote would have to drop from 39% to 37%, their share of the black vote would have to drop from 95% to 90%, and their share of the hispanic vote would have to drop from 72% to 67%:


Regarding the black vote: Democrats attracted between 83-90% support from African Americans in presidential elections from 1984-2004. But the election of one of their own in 2008 boosted those numbers to their now near-unanimous 95%. With another non-African-American Democrat running for President, it's possible to see the African American vote returning to pre-2008 levels of 90% or less for Democrats in 2016.

Thursday, April 25, 2013

Midterm vs. Presidential Demographics: GOP can't count on 2010 turnout in 2014


Reid photo courtesy of A.P.

Throughout the 2012 Presidential election, the likely racial make-up of voters who would make an appearance at the polls on election night was a source of intense debate among pollsters and the media.

Republicans hypothesized the Obama camp would be unable to replicate the record-breaking minority turnout they generated four years earlier, when Obama became the first Democratic President since Jimmy Carter in 1976 to win a majority of the popular vote (and by a much larger margin than Jimmy). Democrats believed their GOTV operation was top-notch and superior to Team Romney's; besides, white voters as a percentage of the electorate had dropped in every presidential election since 1992, while minority voters have been on the rise.

In the end, Republicans were right on one thing, but dead-wrong on everything else. Obama indeed failed to match his 2008 near-landslide defeat of John McCain with Mitt Romney...but he won anyway, and Republicans lost the demographic-debate battle. Not only did minority voters match their turnout numbers from four years earlier, they exceeded it.

Even worse for the GOP, a near-impossible to deny trend in presidential demographics was further confirmed last November- namely, that whites have dropped as a percentage of the electorate in every presidential election since 1992, while non-white voters have increased.

Fortunately for Republicans, the next election will not be a presidential one. 

But does the news really get better for the GOP just by virtue of the fact that the upcoming election is a midterm? What, if anything, do these presidential trends tell us about what we can expect one year and a half from now?

Well, if midterm demographics follow the same pattern presidential demographics followed in 2012, they tell us a good bit.

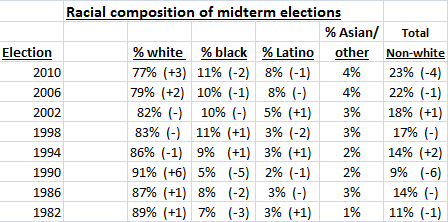
The chart below compiles racial turnout numbers for every midterm election since 1982:

Number in parentheses represents the % change from the preceding presidential election. Information courtesy of Best and Krueger's Exit Polls; Surveying the American Electorate, 1972-2010.

Several pieces of data from the chart stand out.

Tuesday, December 4, 2012

North Carolina: Net Change in Obama's margin against GOP, 2008-2012, county-by-county

Net change of 0 - 2% = light pink               Net Change of 0 - 2% = very light blue
                   2.01 - 4% = pink                                          2.01 - 4% = light blue
                   4.01 - 6% = red                                            4.01 - 6% = blue
                   6.01 - 8% = dark red                                    6.01 - 8% = dark blue
                   8.01% + = very dark red                              8.01% + = very dark blue

Above is a county-by-county map of North Carolina, shaded to represent where President Obama experienced his largest net percentage margin gain & losses against his Republican contender from 2008 to 2012. The red counties are the counties where Obama did worse against Romney than he did against McCain. Likewise, the blue counties are the counties where Obama performed STRONGER against Romney than he did against McCain. The lighter the shade of red or blue, the slighter the difference in the net margins between Obama & his opponent from '08 to '12. The darker shades of red or blue represent where Obama/GOP saw their largest gains from 2008 to 2012.

Monday, November 12, 2012

2016 Not Looking Any Better for Republicans


Days before the polls closed on November 6, 2012, the Obama team was predicting publicly that the electorate would be less white than in 2008, and they were right. Their argument went like this:

"Since the campaign began, Team Obama has assumed that whites would make up 72% of voters, down from 74% in 2008. (The logic: This percentage has decreased in every U.S. election, and the minority population continues to grow.) On the other hand, Republicans counter that due to greater GOP enthusiasm, the white percentage could very well stay the same as in 2008 -- or even be a tick higher. And according to our NBC/WSJ pollsters, the final outcome here could sway the election. If you assume that both sides maximize their margins (Romney wins whites by 20 percentage points and Obama wins minority voters by 60 percentage points), whites making up 75% of the electorate would give Romney the edge with the popular vote by a fraction of a point. But if the white percentage is 74%, Obama would win the popular vote by a fraction of a point. And if it’s 73%, Obama wins by one point. Bottom line: Watch the white percentage in tomorrow night’s exit polls; it will tell you more about where Virginia or Iowa or Colorado or Wisconsin will go." 

Seems awfully prophetic in retrospect.

Further evidence that something has to do be done about the GOP / non-white voter divide


Mitt Romney won a larger percentage of the white vote than George W. Bush in 2004, but that wasn't enough to overcome massive deficits with non-white voters. Perhaps the best example of this lies with the Latino vote. Romney lost the third largest voting block by an astonishing 44 points (71-27%). Compare this to 2004, when Bush ran just 9 points behind John Kerry among a group that made up  8% of the electorate (44-53%). Or compare it to the 2008 Democratic landslide in which McCain lost the Latino vote by 36 points, or 67-31%.

Considering that current tallies have the national popular vote at about 50.6% for Obama, and 47.8% for Romney, how well would Mitt Romney have had to do with Latinos in order to overcome Obama in the national popular vote?

Wednesday, November 7, 2012

A look at 2012 Demographics

Myself and others speculated that if the GOP won white voters by about 20 points or more, that would offset any gains for Democrats from white turnout being held at 2008 levels (when they made up 74% of the electorate). And indeed, Romney performed much better among white voters than John McCain four years earlier, winning the largest voting block 59-39%. McCain only carried the group by 12%.

But what many did not count on (myself included) was a full 2% drop in the number of white voters in the electorate. That, coupled with 2008-like African American turnout, increased Latino turnout, and a stronger Obama margin with Latinos led to Romney's demise.