Tuesday, March 19, 2013

2016: Paul Ryan More Unpopular than Sarah Palin, John Edwards, and Joe Lieberman Were At This Point

2004 Vice Presidential nominee John Edwards (D) (left) actually had a much better net favorability rating at this point in time following the 2004 election than either 2012 nominee Paul Ryan (R), or 2008 nominee Sarah Palin (R).
GOP budget-guy, numbers-hunk, and one-time promising candidate for President in 2012 and 2016 got smacked with some upsetting "numbers" himself this week when Rasmussen Reports released their latest national survey on likely voter impressions of the would-be Vice President: 

Do you have a favorable or unfavorable opinion of Paul Ryan? (nat'l survey of 1,000 likely voters conducted March 14-15, 2013)
Favorable:    35%   (-8)*
Unfavorable:   54%   (+8)
*Number in parentheses represent the percent-change in Ryan's favorable/unfavorable rating among likely voters nationwide since Rasmussen's previous poll on the race in January.

Only a little more than 1 in 3 likely voters view the young Wisconsin Congressman favorably, while a solid majority see him unfavorably. To be blunt, those are really awful numbers. We're talking Nancy Pelosi, Sarah Palin type numbers. But they're even worse in the context of where he once stood on Rasmussen Reports, as recently as just two and seven months ago:


Over the course of just two months, views of Paul Ryan have gone from being split evenly among the electorate, to tilting overwhelmingly unfavorable...at least, according to Rasmussen Reports. Where did his massive 16 point negative downturn since January come from? Ryan fell across the board, but most notably among Republicans. In fact, his drop among Republicans is so stark that you almost have to chalk it up to statistical error. For example, a whopping 40% of his own party views him unfavorably, with just 52% seeing him favorably. Compare that to his January Rasmussen rating, when his fav/unfav rating was a staggeringly high 76/14% among Republicans.

Even outside of Rasmussen Reports, you can detect a distinct downward trajectory since the election last November in Paul Ryan's favorability ratings. Perhaps his 'front-and-center' role in the nation's budget debate is to blame. Or perhaps it's due to the Democratic-created notion that Paul Ryan wants to end Medicare as we know it. Or perhaps it's simply his association with a failed presidential campaign. Either way, his post election favorability ratings have been worse than each of the 3 preceeding Vice Presidential losers before him, at a similar point in time following their election loss; the 3 VP nominees being Sarah Palin (R), John Edwards (D), and Joe Lieberman (D). The chart below averages the findings of every favorability survey on the four former VP nominees, from the time of their selection, until present day (or the equivalent thereof in 2009, 2005, and 2001). The full list of each nominee's favorable/unfavorable ratings can be found here, and was compiled from Pollster, TPM Poll tracker, Poll Report, and National Journal.


While all four of the most recent failed Vice Presidential candidates maintained overall positive favorability ratings from the time of their selection to this point in their post-VP run, Paul Ryan's rating remains the lowest, at just 41/40%. Consider the fact that both Joe Lieberman AND John Edwards (pre-love-child scandal, of course) maintained personal favorable ratings of +20 or more (44/15% and 46/26%, respectively). In short, Joe Lieberman was the most popular VP nominee of the last 4 elections, while Paul Ryan is the least (based on favorability ratings from the time of their selection to this point in their post-VP runs).

Thursday, March 14, 2013

New Jersey Senate 2014: Geraldo Rivera's very, very longshot against Cory Booker

Photo courtesy of Steve Zmijewski, Townsquare Media NJ
The midterm elections, which are typically giant snooze-fests compared to presidential contests, are shaping up to be a downright intriguing, if not puzzling affair. From a Hollywood starlets possible run in Appalachia, to a gay, South Carolina conservative considering a primary challenge from the right against Sen. Lindsey Graham (R-SC), to a former Florida Republican Governor hoping to regain his old seat from the GOP incumbent as a...wait for it...Democrat, there seems to be no shortage of attention-grabbing contests in 2014. And IF Geraldo Rivera throws his name in the ring, you can count the New Jersey Senate race as one of them.

Newark, New Jersey Mayor Cory Booker has long been at the top of Democratic party big wig's list of pols with the most potential; sort-of like the next Barack Obama (who will be exiting the national political stage for good in less than four years). He has many of the qualities Barack possesses; an uncanny ability to connect with people, a burgeoning charisma, and ambition, ambition, ambition! The only problem for party leaders is elevating him from his position of mayor to an office that could serve as a launching pad for something greater. New Jersey Democrats deeply wanted him to challenge Christie in the New Jersey Govenror's race, and just as it began to look like he may, Hurricane Sandy happened, Chris Christie reached near God-like status, and naturally, Booker chickened out. But if Booker was afraid of Gov Christie, he was more than willing to let establishment NJ Democrats know he was NOT afraid of 89 year old, 30 year Senator Frank Lautenberg (D-NJ). Despite some tough words threatening a Democratic primary from the Lautenberg camp, the old-man acquiesced, and announced his retirement just a few weeks ago. Since then, limited polling has been pretty strong for Booker in both the Democratic primary and the general election. And according to the new Fairleigh Dickinson PublicMind survey, this remains true even when New Jerseyans are given well-known journalist/TV personality Geraldo Rivera as the Republican choice for Senator in 2014: 

If the election for Frank Lautenberg’s United States Senate seat was held today, and the choice was Democrat Cory Booker or Republican Geraldo Rivera, for whom would you vote?
Cory Booker (D)  -  52%
Geraldo Rivera (R)  -  21%
Unsure  -  23%
If Republicans were hoping that Geraldo would be their savior in New Jersey in 2014, think again. But honestly, who else would give Booker a better run for his money? Nonetheless, let's take a look at where Booker is drawing his strength from through the prism of racial/ethnic identification. Right off the bat, the Fairleigh Dickinson cross tabs draw your attention to the fact that Booker leads Rivera by 27 points, 50-23%, with white voters (he also leads among non-white voters, 60-16%). But Rivera shouldn't let this fact alone keep him from entering the race, especially when you consider how unlikely it is that Booker's support from white's will last through a partisan campaign. The chart below illustrates this point by noting Democrat and Republican's share of the white and non-white vote in every state-wide NJ election I could find exit poll information for:


First off, notice that no single Republican for statewide office in New Jersey has lost the white vote by more than 4 points since 1992. In every other election in which exit poll data was readily available, Republicans won the white vote anywhere from 1 to 25 points. In fact, in the one New Jersey election where Republicans lost the white vote (1996), a strong third party candidacy from Ross Perot was largely to blame, as well as a very weak Republican candidate in Bob Dole. 

Wednesday, March 13, 2013

Democracy Corps and ABC/WaPo Confirm Obama's Numbers Are Falling

Photo courtesy of imgur
Since yesterday's post rounding up Barack Obama's job approval ratings post-reelection, two reputable organizations have released new surveys that reinforce the evidence that Obama's approvals are dropping.

Earlier today, ABC/Washington Post released a poll showing that the President has lost a net 10 points on his job approval rating since just before his inauguration in January. Then, 55% of American adults APPROVED of the job the President was doing, while just 41% disapproved. Two months later, the number approving of his job performance has dropped 5 points, while the number disapproving jumps 5 points (50/46). 

Just now, Democracy Corps (a reputable Democratic polling firm), released a poll showing Obama underwater with likely voters, with 48% approving of his job performance, and 49% disapproving. In January, he had a strong 54% approval rating, with just 44% disapproving. That's a net 11 point drop for the President in two months. Below is an updated chart (originally posted here) of the President's job approval rating since the sequester took effect. 


Where is Obama's drop in support stemming from? In the ABC/Washington Post poll, it's coming from Independents. Independents approved of the President's job performance by a 54/41% margin in January, whereas today they DISAPPROVE of his performance, 44/50%. That's a 19 point turnaround in just two months. Republicans also saw a net 12 point increase in their disapproval of the President's job performance. In terms of ideological identification and gender, his drop in support was uniform across Liberals, Moderates, Conservatives, men, and women.

New Fairleigh Dickinson Poll of New Jersey shows 1st signs of Chris Christie Bounce Cracking

Barbara Buono (D) has the unenviable task of unseating popular incumbent Gov. Chris Christie (R). On the bright side, she has no where to go but up. Photo courtesy of Corbis.
Just over two weeks ago, I wrote on this blog about Governor Chris Christie's persistently stratospheric job approval ratings in the aftermath of Hurricane Sandy, as well as his apparent insurmountable lead against likely Democratic opponent for Governor, Barbara Buono.

While New Jersey Democrats shouldn't be breaking open any champagne bottles, they're getting a touch of good news in the new Fairleigh Dickinson/PublicMind survey of New Jerseyans' attitude towards Chris Christie and the 2013 Governor's race:

If the election for governor was held today, and the choice was Republican Chris Christie or Democrat Barbara Buono, for whom would you vote (registered voters)?
C. Christie  -  58%  (-6)
B. Buono  -  22%  (+1)
Unsure  -  20%  (+5)
 Obviously, a Democrat trailing her Republican opponent in a blue state by over 30 points is never really good news for the Democrat. But it's the figure in parentheses that people should take note of. Those numbers represent the percent-change in each candidate's standing with New Jersey voters since Fairleigh Dickinson's previous poll on the race in January. As you can see, Christie has seen a fair drop in his statewide support, having led Buono 64-21% two months ago. Of course, when you're already over 60% to begin with, you can afford to take a 6 point hit now and then. But in a deep-blue state, no incumbent Republican can afford to take their Democratic opponent lightly (see Gov. Christine Todd Whitman's 1 point reelection win over Jim McGreevey, after leading for most of the campaign by double digits). Especially considering that Christie's job approval rating with New Jersey voters has also taken a hit:

Fairleigh Dickinson has done a great deal of polling on Christie's approval rating since taking office in 2010, which fortunately makes it easy to pick up on trends. As you can see, Christie's net favorability rating has dropped 14 points since November, immediately following Sandy's landfall. Then, Fairleigh Dickinson  measured his approval rating at 77/17%. Today, it's at a stellar, though less substantial 66/20%. Since January alone, Christie's rating has dropped a net 10 points. Don't get me wrong...Christie can absolutely win with a 66% job approval rating, quite easily. But unlike what I argued at HERE, there does now seem to be at least one pollster finding a small crack in Christie's post-Sandy bounce.

Tuesday, March 12, 2013

Obama Administration's "The Sky Is Falling" Antics Catch Up To The President's Job Approval Rating

Stock Photograph by White House Public Domain
Yesterday, a new McClatchy/Marist survey was accompanied by the following headline: "...Obama Tumbling in voters' eyes." Their conclusion was based on the fact that Barack Obama's job approval rating has fallen to it's lowest point since November of 2011, at 45/48%, while only 34% say the country is on the right track (62% say it's on the wrong track). Their previous survey from early December 2012 had shown the President in positive territory, with 50% of Americans approving of the job he was doing as President, and just 44% disapproving.

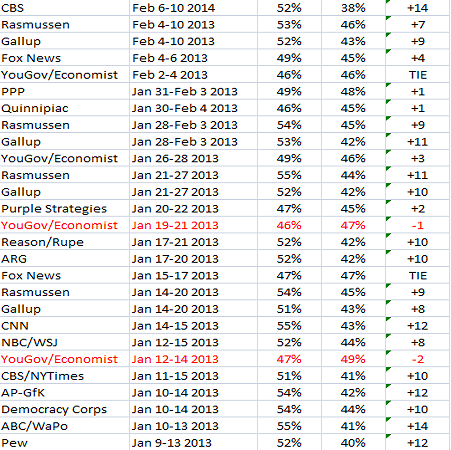
Unfortunately for Obama, the McClatchy/Marist poll is not an anomaly. In fact, the vast majority of pollster's who have examined the President's job approval rating since his reelection have found a decline in his numbers, especially since the sequester took effect just two weeks ago. Consider for example the two daily tracking polls, Gallup and Rasmussen. Before March 1st, the day the budget sequestration officially went into effect, Barack Obama managed an average daily job approval rating of 52/42%, a net +10 points, since his reelection. But an average of Gallup surveys taken after the sequester shows his job rating has fallen to 48/45%, a net decline of 7 points. Meanwhile, the Rasmussen daily tracking survey shows Obama has averaged a 51/48% job approval rating since the sequestration went into effect, compared to a 54/45% job rating from his reelection to March 1st.

The chart below compiles a list of every polling survey on Barack Obama's job approval rating I could find. While poll trackers like Pollster and TPM are helpful, they are often incomplete, excluding various pollsters for particular reasons. The below chart is more complete than any single 1 of the poll trackers, and compiles Barack Obama's average job rating from his reelection last November to today:
**Job approval info courtesy of TPM poll tracker, Huffington Post Pollster, pollingreport.com, and random personal searches.
***Rasmussen and Gallup track the President's approval rating daily. As a result, their numbers in the above chart represent weekly averages.

Monday, March 11, 2013

Key Takeaway for Republicans from Quinnipiac 2016 poll: Pray Hillary doesn't run

Demographic realities provide Hillary (and Democrats generally) with advantages in 2016. Photos courtesy of hillaryclintonoffice.com, & Reuters/AP.
A new nation-wide survey from Quinnipiac University shows Hillary Clinton very well-positioned for 2016 against 3 likely GOP contenders for President: Chris Christie, Paul Ryan, and Marco Rubio:
4. If the election for President were being held today, and the candidates were Hillary Clinton the Democrat and Christopher Christie the Republican, for whom would you vote?

Hillary Clinton  -  45%   (46)
Chris Christie  -  37%   (42)
Don't know/other -  19%  (12)

5. If the election for President were being held today, and the candidates were Hillary Clinton the Democrat and Marco Rubio the Republican, for whom would you vote?

Hillary Clinton  -  50%   (49)
Marco Rubio  -  34%   (41)
Don't know/other  -  16%   (10)

6. If the election for President were being held today, and the candidates were Hillary Clinton the Democrat and Paul Ryan the Republican, for whom would you vote?

Hillary Clinton  -  50%   (50)
Paul Ryan  -  38%   (44)
Don't know/other  -  12%   (6)
*numbers in parentheses indicates the results of a February 3rd, 2013 Public Policy Polling survey

Despite being 4 years out from the election, those are some rough numbers for the GOP, especially considering that Chris Christie and Paul Ryan are fairly well-known nationally, courtesy of Hurricane Sandy and a vice presidential nomination. Of the 3 Republicans tested, it's Paul Ryan who actually scores the highest level of national support (at 38%). The only problem with that is the fact that he elicits stronger support for Hillary Clinton, who comes in at 50%. So Ryan would essentially need to win all 12% of the voters who are undecided at this stage just to match Hillary. While Chris Christie attracts slightly less nationwide support than Paul Ryan (37%), he is able to hold Hillary well under 50%. Perhaps even more interesting, nearly 1 in 5 voters say they would be undecided on a Clinton v. Christie 2016 race. Marco Rubio, unsurprisingly, performs the worst against Clinton, only garnering 34% to her 50%. He is not as well known as Christie or Ryan, and his limited foray into the national spotlight will largely be remembered for this (as trite as it may be)
Unfortunately, it only looks worse for the GOP trio after peering at the Quinnipiac crosstabs. With all the talk of the GOP's demographic troubles, I decided to check out the ethnicity breakdown of the poll sample. 73% of respondents identified as white, 11% as black, 9% as Hispanic, and 7% as Asian/other. Compared to the 2012 election, Quinnipiac is finding registered voters to be more white and less minority. The only problem with that is the fact that white voters have declined as a percentage of the electorate in every election since 1992:


Not only that, but Latino's (a group Obama won in 2012 by a 71-27% margin) have gained in numbers every year since 1992. The African American portion of the electorate was largely static from 1980-2008, when it jumped based on enthusiasm for the first black presidential nominee. The purpose behind all this information is to illustrate that despite Quinnipiac poll findings, the electorate is very unlikely to see an increase in the white vote from 2012, and equally unlikely to see a decrease in the Hispanic vote. In fact, some have even suggested white turnout could drop to under 70% in 2016. Just for fun, what would the Quinnipiac results have looked like with white voters making up less than 70% of the electorate? The below chart illustrates what happens using a racial make-up of 69% white, 12% black, 12% Latino, 7% Asian/other.**

Friday, March 8, 2013

What's the Matter With Jeb Bush? The Moderate 'Kiss of Death'

Chris Christie and Condi Rice are two other possible 2016 candidates that find their largest base of support stemming from self-identified moderate/liberal GOP primary voters. Photos courtesy of Donkeyhotey.

Former Florida Governor Jeb Bush set off a firestorm yesterday after making clear on NBC News he was NOT ruling out a 2016 presidential bid, despite definitively ruling out a 2012 run early in that process. Reaction from a large portion of Conservative Republicans was...well...brutal.

Obviously, the above tweet was one of the more tame responses.

But why all the Jeb Bush hate, from Republicans no less? He's the brother of the once beloved George W. Bush (who still maintains a 45/46% favorability rating with ALL voters, 79/15% with Republicans). He was also a popular two-term Governor of the nation's fourth most populous state from 1998-2006. He is widely viewed as the most thoughtful, articulate, and appealing of the entire Bush clan. But unfortunately for anyone associated with the Bush presidency, Republicans want to win now more than ever. And after two devastating defeats in a row at the ballot box, they seem to want to do it with a fresh face. Just look at the names being tossed around for the 2016 GOP nomination: Chris Christie, Marco Rubio, Paul Ryan, Rand Paul, Susana Martinez, Bobby Jindal, etc. The average age of these guys is 46. Compare that to 2012, when familiar faces like Mitt Romney, Newt Gingrich, Rick Santorum, and Ron Paul were the major GOP contenders. Their average age makes the 2016 crew look like they came straight out of an episode of Glee. No amount of articulation or methodicalness on the part of Jeb can change the fact that Bush is an old name associated with an old political dynasty.

Further hindering a potential Jeb 2016 run is a perception from the Republican base that he is insufficiently conservative; a bit wobbly on issues, especially immigration. In other words, he's a moderate in a conservative party. And the fact that he's quite conservative on a large majority of issues is irrelevant if he is not perceived as such. Consider where Jeb Bush draws the majority of his support. The chart below documents all of the potential GOP candidates' share of moderate/liberal voters in the 4 national 2016 GOP primary polls conducted by Public Policy Polling since last year:

 As you can see, Jeb is most dominant among the moderate/liberal block of GOP primary voters, especially when compared to his overall percentage. He attracts anywhere from 17-24% of this group, while only garnering 8-13% of "very conservative" voters, and 13-19% of "somewhat conservative" voters.

Tuesday, March 5, 2013

It's Not the End of The World for the GOP: A Comparison of 2010 and 2014 Generic Congressional Ballot Polling


Republicans seem to be doing a lot of head-scratching these days. For most of President Obama's time in office, nothing seems to have gone the way they had predicted or hoped. And worse than that, the GOP is receiving the overwhelming majority of the blame from the American public for the country's seeming state of disarray. From the debt ceiling debate, to the "fiscal cliff," to the sequester and more, President Obama has become the new Teflon president, while the GOP can barely muster a quarter of the country to admit they have a favorable view of the party. But how can all of this be? After all, the Democrats have controlled the Senate chamber for the last 6 years, and the White House the last four.  The President's masterful control of the bully pulpit, his continued nationwide, campaign-style advocacy on behalf of his 2nd term agenda, and an obviously supportive D.C. press corps, all have some role in creating the impression of a Republican Party that just can't get it together. 

And to top it off, in the wake of weak white turnout in 2012, there's talk in some circles of an emerging Democratic majority, at least at the presidential level. Sounds like a bit of a disaster for the GOP, huh? Surprisingly, no, not if the generic congressional ballot for 2014 is any indication.

According to both Pollster Trend and TPM Poll Tracker, Democrats currently lead the 2014 generic congressional ballot by just 42-40% and 43-40%, respectively. Regarding the 3 most recent surveys from 3 pollsters that frequently ask the generic ballot question, Republicans actually LEAD in one of them (Harper Polling (R)), TIE in one (PPP (D)), and trail by 3 in the other (Rasmussen). Should these numbers convince the GOP it's time to the shift their views leftward, or cause panic over a Democratic landslide in 2014? Probably not, especially once you consider where Republicans stood on the generic ballot at this point in the 2010 cycle. The below chart compares the 2010 and 2014 generic ballots by looking at an average through the time line of post-election 2008/2012 through the present (early March 2009/2013):
Compiled from TPM and Pollster

Without question, the Tea Party landslide of 2010 was an electoral high-watermark for Republicans over the last quarter century. That year, Republicans gained 63 House seats, 6 senate seats, controlled 29/50 governor seats, and carried the national house vote 51-45%. Yet despite all their success, at this very point in the 2010 cycle, it was the DEMOCRATS that led the Republicans on the generic ballot, 44-37%, as the above chart indicates. By comparison, present-day Republicans are only trailing Democrats on the generic ballot 45-41%. So, here's a message to Republicans: The SKY IS NOT FALLING...yet, at least. Especially not when you realize that no 2nd-term President's party has gained seats in Congress in their final midterm election since 1938, save 1998.

Monday, March 4, 2013

Rick Perry's Possible 2014 Gubernatorial Bid is D.O.A. per PPP, but University of Texas Says Otherwise

Photo courtesy of Corbis

Texans, according to the Democrats favorite polling firm, can't seem to get rid of 3-term Governor Rick Perry, who has refused to rule out a historical fourth bid for the Governor's mansion in 2014. Though there seems to be some disagreement about whether Texans actually want to give him the boot. Public Policy Polling released a brutal survey for Perry last month that showed both the Texas elctorate as a whole, and the Republican primary electorate, wanting Perry to hang it up.

From the PPP release:

Perry could face great peril in a primary challenge next year. Only 41% of GOP primary voters want him to be their candidate again, compared to 47% who think it's time for someone else. And in a head to head match up with Attorney General Greg Abbott, Perry leads by only a 41/38 margin.

“Most Texas voters are ready to move on from Rick Perry,” said Dean Debnam, President of Public Policy Polling. “They think it’s time for a new Governor."
To hear PPP explain it, Rick Perry, who remains undecided on seeking a fourth term as Governor, should definitely consider retiring. The general Texas electorate and the primary electorate all agree on this fact. And miraculously, Perry, who easily trounced his BIG-NAME opponent Kay Bailey Hutchison four years earlier in the GOP primary, only leads the largely unknown Republican Atty General in a hypothetical primary battle by 3 points, 41-38%. With numbers like that, it would require a certain degree of irrational stubbornness to proceed with what appears to be a losing battle, right?

Fortunately for Team Perry, there are two important data points that dispute the notion that the Governor is D.O.A. for a 2014 bid. 1) A new University of Texas internet poll directly contradicts PPP's January finding, showing Rick Perry quite strong in a GOP primary, at least at this early stage of the race. And 2) PPP has a history of finding a very weak Rick Perry at early stages of past contests, only to see him turn it around in the closing months.

Regarding the UT Poll: Rick Perry leads Attorney General Greg Abbott by a near 3-to-1 margin:

In a 2014 Republican primary for Governor held today, who would get your vote? (Taken Feb. 14 - 24, 2013, among Republican voters)
Rick Perry (R) -  49%
Greg Abbott (R) -  17%
No Opinion -  31%

That's a world of difference from PPP's finding of a statistical tie. And Rick Perry's 49% showing is just barely short of the 50% required by Texas law to avoid a run-off. In 2009, Perry consistently polled in the 30s and lower 40s at this point of the primary campaign (see chart below). If it does come down to Perry v. Abbot next March, Perry is starting in a much better position than he did against Hutchison in 2009.

Beyond the UT poll, however, is the fact that despite Perry's poor showing in the January PPP poll, he can take comfort knowing weak, early PPP findings haven't stopped him before. Outside of an internal poll done on behalf of the Kay Bailey Hutchison (R) campaign, PPP was the ONLY pollster of the 2009-2010 TX Gubernatorial polling cycle to show Hutchison with a lead against Perry as large as 25 points. During that same period of time, other pollsters found Hutchison AND Perry with only narrow leads over the other. The chart below documents all 25 polls released on the 2010 TX primary, taken after the 2008 election:


Thursday, February 28, 2013

Republican Primary Electorate Moves Right, Democrats Stationary (a look at primary exit polling, 1996-2012)

The 2000 primary battle between Bush & McCain featured a notably less conservative primary electorate than in 2012. The Gore/Bradley primary electorate was similar to 2008.  Images courtesy of Corbis.

Since the birth of the Tea Party Movement in the aftermath of the election of Barack Obama in 2009, the American public has been subjected to claims by the media that the Republican party of today is more Conservative than the GOP of the 1980s and 90's, or even that of George W. Bush. But is that actually the case? Yes, at least based on the way Republican primary voters have viewed their own ideologies since 1996.

Sure, there have been studies indicating CONGRESSIONAL Republicans have become more Conservative, but have the rank and file followed their lead? A close examination of GOP primary exit polling from 1996-2012 indicates they have. In the 20 states where exit polling was conducted in 2012, Republican primary voters were split exactly into thirds between identifying as "very conservative," "somewhat conservative," or "moderate/liberal." To be exact, 34% of Republican primary voters identified their own political ideologies as "very conservative." That number ranged from a nationwide high of 49% in the Louisiana and Nevada primary contests, to a low of just 15% in Massachusetts (no surprise there). Meanwhile, 33% of Republican primary voters nationwide identified as "somewhat conservative", while the remaining 33% identified as "moderate or liberal." The "moderate/liberal" voters' largest share of the Republican electorate came in the Vermont primary (where they made up 53% of voters), Massachusetts primary (where they made up 49%), and New Hampshire primary (where they made up 47%). Conversely, moderate/liberals saw their smallest shares of the GOP electorate in Iowa (17%), Nevada (17%), and Louisiana (23%).

So there you have it: the ideological identity of Republican primary voters NATIONWIDE in 2012 was 34% very conservative, 33% somewhat conservative, and 33% moderate/liberal (based on the findings of the network's 20-individual-state exit polls). On its face, nothing sounds terribly conservative about that breakdown. Republicans are, after all, the national conservative party. So 67% of the national primary electorate identifying as at least somewhat conservative should probably be expected. But when you compare that split to the three previous Republican primaries in 2008, 2000, and 1996, you see the Republican primary electorate has become considerably less moderate or liberal, and considerably more conservative. See the chart below:
To see the math on how I compiled the above figures from exit polling, see this dataset


Monday, February 25, 2013

Chris Christie's post-Sandy Bounce Holding Strong 4 Months Later, Buono (D) Barely On The Radar

Photo courtesy of Jewel Samad/AFP/Getty

From the standpoint of political popularity, it doesn't get much better than it currently is for New Jersey Governor Chris Christie (R). He assumed office in 2009 with a respectable 3.5 point victory over the incumbent Democrat, and remained reasonably well-liked, reforming state pensions and taking on the teachers union, in a state known for its preference for Democratic politicians.
But that all changed in the days following October 30, 2012. Hurricane Sandy made landfall in New Jersey, and Chris Christie made a very impassioned, and very public plea for aid for New Jersey residents. Furthermore, as President Obama toured the storm-ravaged area, just days before his reelection, Republican Christie heaped praise on him, to an excessive degree in the minds of many Romney supporters. The total effect of Christie's leadership and bipartisan cooperation in the wake of a devastating storm had a huge lifting affect on attitudes towards Christie personally, as well as the job he was doing in New Jersey. Even nationally, Christie saw a boost in his ratings.

That's why the much touted Newark Mayor, Cory Booker (D) decided against a 2013 gubernatorial run last month. At a point before Hurricane Sandy, Christie was viewed as vulnerable in 2013, and not just because he was your standard Republican running for reelection in a Democratic state, but also because Booker was particularly popular among the Democratic base. In fact, PPP found Booker beating Christie in a hypothetical race in July, 47-43%. Quinnipiac found him trailing just 46-42% in October, while also finding the little-known State Senator Barbara Buono losing by a to-be-expected 49-33% margin. But unfortunately for both of them, that's not the Chris Christie they will get to face in November 2013. No, the new, wildly popular, post-Sandy Christie led Booker in polling by anywhere from 14 to 18 points. As for the woman who is most likely to actually have to face Christie?...
Quinnipiac Poll, Feb 13-17, 2013; NJ Gubernatorial Race:

Chris Christie (R)  -  62%
Barbara Buono (D)  -  25%

She trails by a staggering 37 points. In a post on this blog in December, I argued that Cory Booker, as the Democrats strongest candidate, should still consider running for Governor, under the belief that Christie's post-Sandy job approval would inevitably fade. But as of today, his numbers have shown no recent signs of fading: Consider the below chart on Christie's job approval rating since he took office in 2010:

Compiled from TPM, The Argo Journal, and other random finds

Wednesday, February 20, 2013

HILLARYLAND: Early In 2016 Race, PPP Finds A Nearly Invincible Hillary Clinton


In 2008, Barack Obama carried 365 electoral college votes against John McCain, roughly on par with the 379 electoral college votes Bill Clinton carried against Bob Dole in 1996, and 1 of the largest electoral college victories since George H. W. Bush trounced Michael Dukakis in 1988, 426-111.

But according to Public Policy Polling (D), when voters are given Hillary Clinton as a hypothetical presidential choice for 2016, she would win in a landslide at least larger than Obama's in 2008 and her husband's in 1996, and at most, would rival FDR, Richard Nixon, and Ronald Reagan for 1 of the largest landslides in history.

A string of recent 2016 polling from the prolific Democratic pollster indicates that Hillary Clinton would be, by far, the Democrat's strongest candidate in a generation. In states as traditionally conservative as Alaska, Texas, Kentucky, Louisiana, and Georgia, Hillary would tie OR defeat every single one of her potential Republican rivals. This fact is far more astounding when you consider that Barack Obama lost all five of these deep-red states in both 2008 and 2012, by no less than 8 points (in Georgia), and no more than 23 points (in Kentucky). Furthermore, Kentucky & Louisiana have not voted Democratic since 1996, Georgia since 1992, Texas since 1976, and Alaska since 1964.  

But just for fun, let's assume Hillary Clinton wins every state Obama won in 2012 (for a total of 332 electoral college votes), as well as the five additional deep-red states PPP finds Hillary performing well in:


That puts Hillary's ECV total at 389, to 149 for her hypothetical Republican opponent (the lowest ECV total for a Republican since Barry Goldwater in 1964!). But really, if PPP is correct regarding their red-state, 2016 polling, what are the odds that Hillary Clinton would win AK, TX, KY, LA, & GA, but lose other less Republican states, such as North Carolina, Indiana, Missouri, or Arizona? Quite slim. The below map takes a look at how many states Hillary Clinton could win in the event she wins every state Obama lost in 2012 by 14 points or less (the margin by which Obama lost Alaska, one of the five red states where PPP finds Hillary Clinton defeating her likely Republican opponents):